Analytics platform trial

Information Services is evaluating a new collaborative platform for data-science and analytics as part of its expanding portfolio of services for researchers. We are looking for researchers with suitable problems who expect to achieve results in the one-year trial. We will be able to work closely with a small number of projects to help them get the most out of the platform, and training will be available. In addition, we encourage further researchers to use the platform with less formal support.

The Aridhia AnalytiXagility Platform

AnalytiXagility is a purpose-built, user-friendly, collaborative platform for data science and analytics. It allows your team to easily create, discuss, modify and share analyses in a single, secure system accessed conveniently through a web browser.
The platform handles routine data management tasks such as confidentiality, availability, integrity and audit, reducing time to insight and discovery. In particular, it is ideally suited for:

  • Exploring, comparing and linking structured datasets including data quality profiling
  • Supporting data management, accountability and provenance
  • Processing large datasets that do not fit in memory

Bring your team

Project members collaborate through a private workspace configured with compute, storage and analytical tools. Embedded social media tools allow teams to post and share questions, updates, comments and insights, building an active record of the research undertaken.

Bring your data

Users import their datasets using the secure and reliable file transfer mechanism, SFTP. Working files (documents, images, analysis scripts) can be uploaded directly through the web interface, and tagged for easy management and retrieval by the team.

Bring your analysis

AnalytiXagility provides an analysis platform, based on R, which can be accessed through a web browser. Combining R with an SQL database and an associated access library allows researchers to analyse their data in a faster and more scalable way than with R alone.

Generate your output

The platform supports generation of PDF reports for communication and publication using LaTeX templates, such as those provided by many leading journals, in which users can embed active analytical scripts to auto-generate images and tabular data within the report at runtime.

More information

If you are interested in participating in the trial, please email IS.Helpline@ed.ac.uk with the subject “XAP Trial”.

Further information can be found at:

Steve Thorn
Research Services
IT Infrastructure

Fostering open science in social science

FOSTER_logoOn 10th of June, the Data Library team ran two workshops in association with the EU Horizon 2020 project, FOSTER (Facilitate Open Science Training for European Research), and the Scottish Graduate School of Social Science.

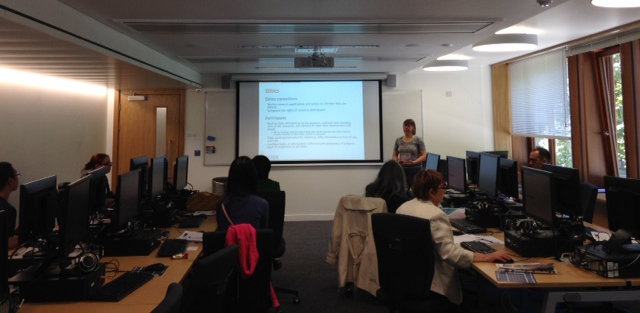
The aim of the morning workshop, “Good practice in data management & data sharing with social research,” was to provide new entrants into the Scottish Graduate School of Social Science with a grounding in research data management using our online interactive training resource MANTRA, which covers good practice in data management and issues associated with data sharing.

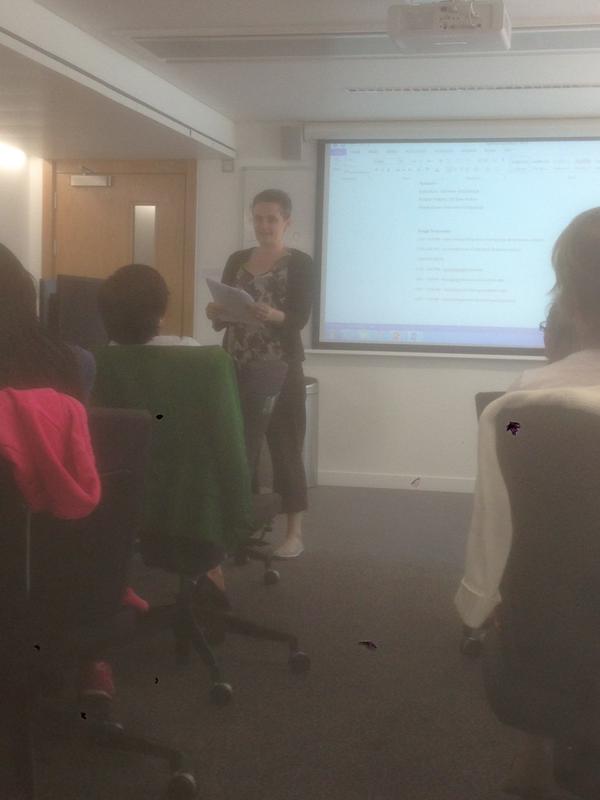
The morning started with a brief presentation by Robin Rice on ‘open science’ and its meaning for the social sciences. Pauline Ward then demonstrated the importance of data management plans to ensure work is safeguarded and that data sharing is made possible. I introduced MANTRA briefly, and then Laine Ruus assigned different MANTRA units to participants and asked them to briefly go through the units and extract one or two key messages and report back to the rest of the group. After the coffee break we had another presentation on ethics, informed consent and the barriers for sharing, and we finished the morning session with a ‘Do’s and Dont’s exercise where we asked participants to write in post-it notes the things they remembered, the things they were taking with them from the workshop: green for things they should DO, and pink for those they should NOT. Here are some of the points the learners posted:

DO
– consider your usernames & passwords
– read the Data Protection Act
– check funder/institution regulations/policies
– obtain informed consent
– design a clear consent form
– give participants info about the research
– inform participants of how we will manage data
– confidentiality
– label your data with enough info to retrieve it in future
– develop a data management plan
– follow the certain policies when you re-use dataset[s] created by others
– have a clear data storage plan
– think about how & how long you will store your data
– store data in at least 3 places, in at least 2 separate locations
– backup!
– consider how/where you back up your data
– delete or archive old versions
– data preservation
– keep your data safe and secure with the help of facilities of fund bodies or university
– think about sharing
– consider sharing at all stages. Think about who will use my data next
– share data (responsibly)

DON’T
– unclear informed consent
– a sense of forcing participants to be part of research
– do not store sensitive information unless necessary
– don’t staple consent forms to de-identified data records/store them together
– take information security for granted
– assume all software will be able to handle your data
– don’t assume you will remember stuff. Document your data
– assume people understand
– disclose participants’ identity
– leave computer on
– share confidential data
– leave your laptop on the bus!
– leave your laptop on the train!
– leave your files on a train!
– don’t forget it is not just my data, it is public data
– forget to future proof

Robin Rice presenting at FOSTERing Open Science workshop

Our message was that open science will thrive when researchers:

  • organise and version their data files effectively,
  • provide comprehensive and sufficient documentation for others to understand and replicate results and thus cite the source properly
  • know how to store and transport your data safely and securely (ensuring backup and encryption)
  • understand legal and ethical requirements for managing data about human subjects
  • Recognise the importance of good research data management practice in your own context

The afternoon workshop on “Overcoming obstacles to sharing data about human subjects” built on one of the main themes introduced in the morning, with a large overlap of attendees. The ethical and regulatory issues in this area can appear daunting. However, data created from research with human subjects are valuable, and therefore are worth sharing for all the same reasons as other research data (impact, transparency, validation etc). So it was heartening to find ourselves working with a group of mostly new PhD students, keen to find ways to anonymise, aggregate, or otherwise transform their data appropriately to allow sharing.

Robin Rice introduced the Data Protection Act, as it relates to research with human subjects, and ethical considerations. Naturally, we directed our participants to MANTRA, which has detailed information on the ethical and practical issues, with specific modules on “Data protection, rights & access” and “Sharing, preservation & licensing”. Of course not all data are suitable for sharing, and there are risks to be considered.

In many cases, data can be anonymised effectively, to allow the data to be shared. Richard Welpton from the UK Data Archive shared practical information on anonymisation approaches and tools for ‘statistical disclosure control’, recommending sdcMicroGUI (a graphical interface for carrying out anonymisation techniques, which is an R package, but should require no knowledge of the R language).

DrNiamhMooreFinally Dr Niamh Moore from University of Edinburgh shared her experiences of sharing qualitative data. She spoke about the need to respect the wishes of subjects, her research gathering oral history, and the enthusiasm of many of her human subjects to be named in her research outputs, in a sense to own their own story, their own words.

Links:

Rocio von Jungenfeld & Pauline Ward
EDINA and Data Library

Highlights from the RDM Programme Progress Report: Mar. & Apr. 2015

9 EPSRC grant holders and researchers were interviewed as follow-up to the EPSRC Expectations Awareness Survey conducted in February.

A new leaflet detailing all systems in the RDM portfolio is being created, which will explain the Data Asset Register, and the use of PURE, in the context of all the systems available across the research lifecycle.

The PURE system now has a module that allows the datasets to be described. This fulfils EPSRC Research Data Expectations requiring datasets to be described and those descriptions made available online. Datasets described in PURE are shown as part of staff online profiles in Edinburgh Research Explorer alongside other research outputs.

The RDM Service Coordinator gave an invited presentation at the “Open access and research data management: Horizon 2020 and beyond” FOSTER Workshop, University College Cork, Eire (15 Apr. 2015) – https://www.fosteropenscience.eu/content/looking-after-your-data-rdm-edinburgh-institutional-approach

DCC and RDM programme staff to meet with key contacts in selected schools to discuss local support and draft guidance.

DataShare release 1.7.2 went live in April with a new default open licence – Creative Commons International Attribution, 4.0 (CC-BY 4.0) to replace the Open Data Commons Attribution licence.

Discussion is on-going between UNC-Chapel Hill, Data Library and colleagues in Web, Learning, and Teaching Division about collaborating on ‘MANTRA as a MOOC’ to be delivered next autumn.

ITI / Research Services are to investigate provision of a hosted GIT service for research software generated for research at the university.

RDM programme webpages in Polopoly are being checked for accuracy and compliance for their planned migration to Drupal.

All Schools in CHSS have now added links to the RDM Programme website and other RDM pages through their intranets. GeoSciences, Chemistry, Informatics and Mathematics in CSE have also added said links via their intranets.

Content has been finalised for the new ‘Working with personal and sensitive data’ RDM course.

Stuart Macdonald
RDM Service Coordinator

Data Visualisation with D3 workshop

Last week I attended the 4th HSS Digital Day of Ideas 2015. Amongst networking and some interesting presentations on the use of digital technologies in humanities research (the two presentations I attended focused on analysis and visualisation of historical records), I attended the hands-on `Data Visualisation with D3′ workshop run by Uta Hinrichs, which I thoroughly enjoyed.

The workshop was a crash course to start visualising data combining d3.js and leaflet.js libraries, with HTML, SVG, and CSS. For this, we needed to have installed a text editor (e.g. Notepad++, TextWrangler) and a server environment for local development (e.g. WAMP, MAMP). With the software installed beforehand, I was ready to script as soon as I got there. We were recommended to use Chrome (or Safari), for it seems to work best for JavaScript, and the developer tools it offers are pretty good.

First, we started with the basics of how the d3.js library and other JavaScript libraries, such as jquery or leaflet, are incorporated into basic HTML pages. D3 is an open source library developed by Mike Bostocks. All the ‘visualisation magic’ happens in the browser, which takes the HTML file and processes the scripts as displayed in the console. The data used in the visualisation is pulled into the console, thus you cannot hide the data.

For this visualisation (D3 Visual Elements), the browser uses the content of the HTML file to call the d3.js library and the data into the console. In this example, the HTML contains a bit of CSS and SVG (Scalable Vector Graphics) element with a d3.js script which pulls data from a CSV file containing the details: author and number of books. The visualisation displays the authors’ names and bars representing the number of books each author has written. The bars change colour and display the number of books when you hover over.

Visualising CSV data with D3 JavaScript library

The second visualisation we worked on was the combination of geo-referenced data and leaflet.js library. Here, we combine the d3.js and leaflet.js libraries to display geographic data from a CSV file. First we ensured the OpenStreetMap loaded, then pulled the CSV data in and last customised the map using a different map tile. We also added data points to the map and pop-up tags.

Visualising CSV data using leaflet JavaScript library

In this 2-hour workshop, Uta Hinrichs managed to give a flavour of the possibilities that JavaScript libraries offer and how ‘relatively easy’ it is to visualise data online.

Workshop links:

Other links:

Rocio von Jungenfeld
EDINA and Data Library