The end of May and start of June is always a busy time for conferences and this year has been no exception. Luckily, at the start of June, I was able to attend the International Conference on Concepts of Library and Information Science (CoLIS). CoLIS is a series of international conferences aiming to provide a broad forum for the exploration and exchange of ideas in the field of Library and Information Science, Information Studies, and related disciplines. The events took place in Glasgow and were hosted by the Department of Computer and Information Science at the University of Strathclyde, which rather neatly was where I studied for my MSc in Information and Library Studies, as well as my PhD. Proceedings included a civic reception at Glasgow City Chambers and a dinner and ceilidh at Oran Mor.
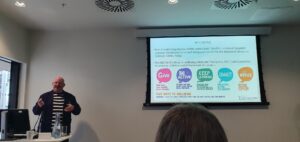
Keith Munro giving his presentation at the conference – Photo credit: Perla Innocenti
I was grateful to be able present findings from my PhD, where I discussed the wellbeing benefits observed amongst hikers on the West Highland Way and how they can be linked to concepts in information science, receiving thoughtful feedback and questions from expert researchers. I was also very fortunate to help facilitate a workshop on embodied information alongside Jenna Hartel (University of Toronto) and Laura Williams (University of Sheffield), and wonderfully led by Shannon Crawford Barniskis (University of Kentucky). This event featured everything from amateur (well certainly from me) dramatics, olfactory surprises (pleasant ones, in the form of essential oils), stretching exercises, vlogs about running, music playlist creation and more besides, highlighting in a short space of time the wealth of directions that future research on embodied information can take.
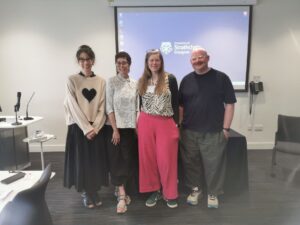
From left to right: Jenna Hartel, Shannon Crawford Barniskis, Laura Williams and Keith Munro – Photo credit: unknown
The three keynote speeches were highlights of the conference and covered a wide range of concepts in Library and Information Science. Firstly, Jenna Hartel used Marcia Bates’ concept of the red thread of information to weave a fascinating, though-provoking picture of how consideration of the serious leisure perspective, the study of hobbies, interests and activities that people devote a great deal of their life to, can continue to generate new insight into information behaviour, symbiotically creating innovative research methodologies and novel ways to teach concepts in Library and Information Science. Their talk also showcased their skill as researcher and as a teacher, using multimedia elements to relate key concepts and meaningfully engage with their audience.
On the second day of the conference, Dr Adele Patrick gave a very inspiring talk about the history and present-day activities of the Glasgow Women’s Library. I greatly appreciated the way they described the care they gave to people in the library’s physical space and how it was experienced by visitors, this seemed to be of equal importance as the contents of the collection. This perfectly illustrates how the consideration of people’s bodies in library and other information spaces, is vital to making collections accessible, as well as being a practical example of how embodied information is not just an academic concept, but something that should be central to the provision of library services. I was also struck by how large institutions, such as national or university libraries, can learn from the best practice of independent organisations, where values and approaches are developed from grass-roots upwards.

Toma Tasovac delivering his keynote speech – Photo credit: Keith Munro
The final keynote was given by Dr Toma Tasovac, Director of the Belgrade Center for Digital Humanities (BCDH) and Director of the pan-European Digital Research Infrastructure for the Arts and Humanities (DARIAH-EU), who took the opportunity to question whether libraries are still “imprisoned by the print mind”. This talk really resonated with me in my role in the Research Data Support team as it raised fascinating issues and concepts around whether library collections themselves are data, as well as what can be considered supporting digital data in the Arts and Humanities. I find the latter in particular to be an area of great interest, that there could be a wealth of supporting material for Arts and Humanities research that doesn’t get captured digitally because researchers think that data just means spreadsheets. Finding ways to advocate for the inclusion of novel research outputs, less commonly encountered types of data, is a means to promote a greater understanding of the value of researchers’ work in totality, rather than just by the metrics of publishing. This can help create archives that will be of significant cultural value as time progresses.
I also greatly enjoyed attending two of the conference’s alternative events on Information Art, organised by Andrea Kampen (University of British Columbia) and Rebecca Noone (University of Glasgow), and on information practices during transitional, life-changing events, facilitated by Jenny Bronstein (Tel Aviv University), Perla Innocenti (University of Strathclyde) and Jette Seiden Hyldegård (University of Copenhagen). Both had in common creative ways to encourage participants to engage with the concepts, from creating art using collage techniques to mapping from memory. These creative and collaborative activities were a refreshing way to engage the brain in a different way in between the many fascinating presentations.
It is hard to narrow down all the interesting talks I heard, but I would like to at least briefly mention the following, in no particular order: Genre knowledge: a metacognitive approach to exploring document practices in science by Samuel Dodson; The knowledge organisation of sub-subgenres: the curious case of the collaborative works of Gilbert and Sullivan by Deborah Lee (University College London); Geographical information ranges: conceptualising holistic information landscapes by Kaitlin Montague (Humboldt University); Reciprocity in information exchange: how social exchange enriches collaborative research partnerships by Joann Cattlin (RMIT University) and Lisa Given (RMIT University); Informational self-deception: deconstruction and reconstruction within philosophy of information by Juliana Mestre (Rutgers University); ‘It’s a wide cluster of noise’: experiencing and describing information from environmental sounds by Owen Stewart-Robertson (McGill University); and The multispecies perspective in library and information science by Niloofar Solhjoo (Charles Sturt University). I haven’t even touched on the wonderful posters I saw, but in the interest of some attempt at brevity, I will stop here. I encourage you to look at the proceedings online.
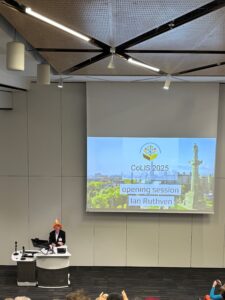
Ian Ruthven giving the welcome speech – Photo credit: Keith Munro
Thanks go to the Conference Chairs, Ian Ruthven, Perla Innocenti and Emma Nicol, as well as the wonderful team of volunteers from the PhD and Masters programmes from the Department of Computer and Information Science at the University of Strathclyde. Congratulations on such a memorable, rewarding experience for all!
All the full and short papers from the conference can be viewed through the following link: Vol. 30 No. CoLIS (2025): Proceedings of CoLIS: 12th International Conference on Conceptions of Library and Information Science – University of Strathclyde, Glasgow, UK, 2nd-5th June 2025 | Information Research an international electronic journal
The abstracts for the alternative events, papers and posters can be viewed in the following link: Adjunct Proceedings of CoLIS : 12th International Conference on Conceptions of Library and Information Science
Keith Munro,
Research Data Support Assistant

 From the Arts