Data Visualisation with D3 workshop

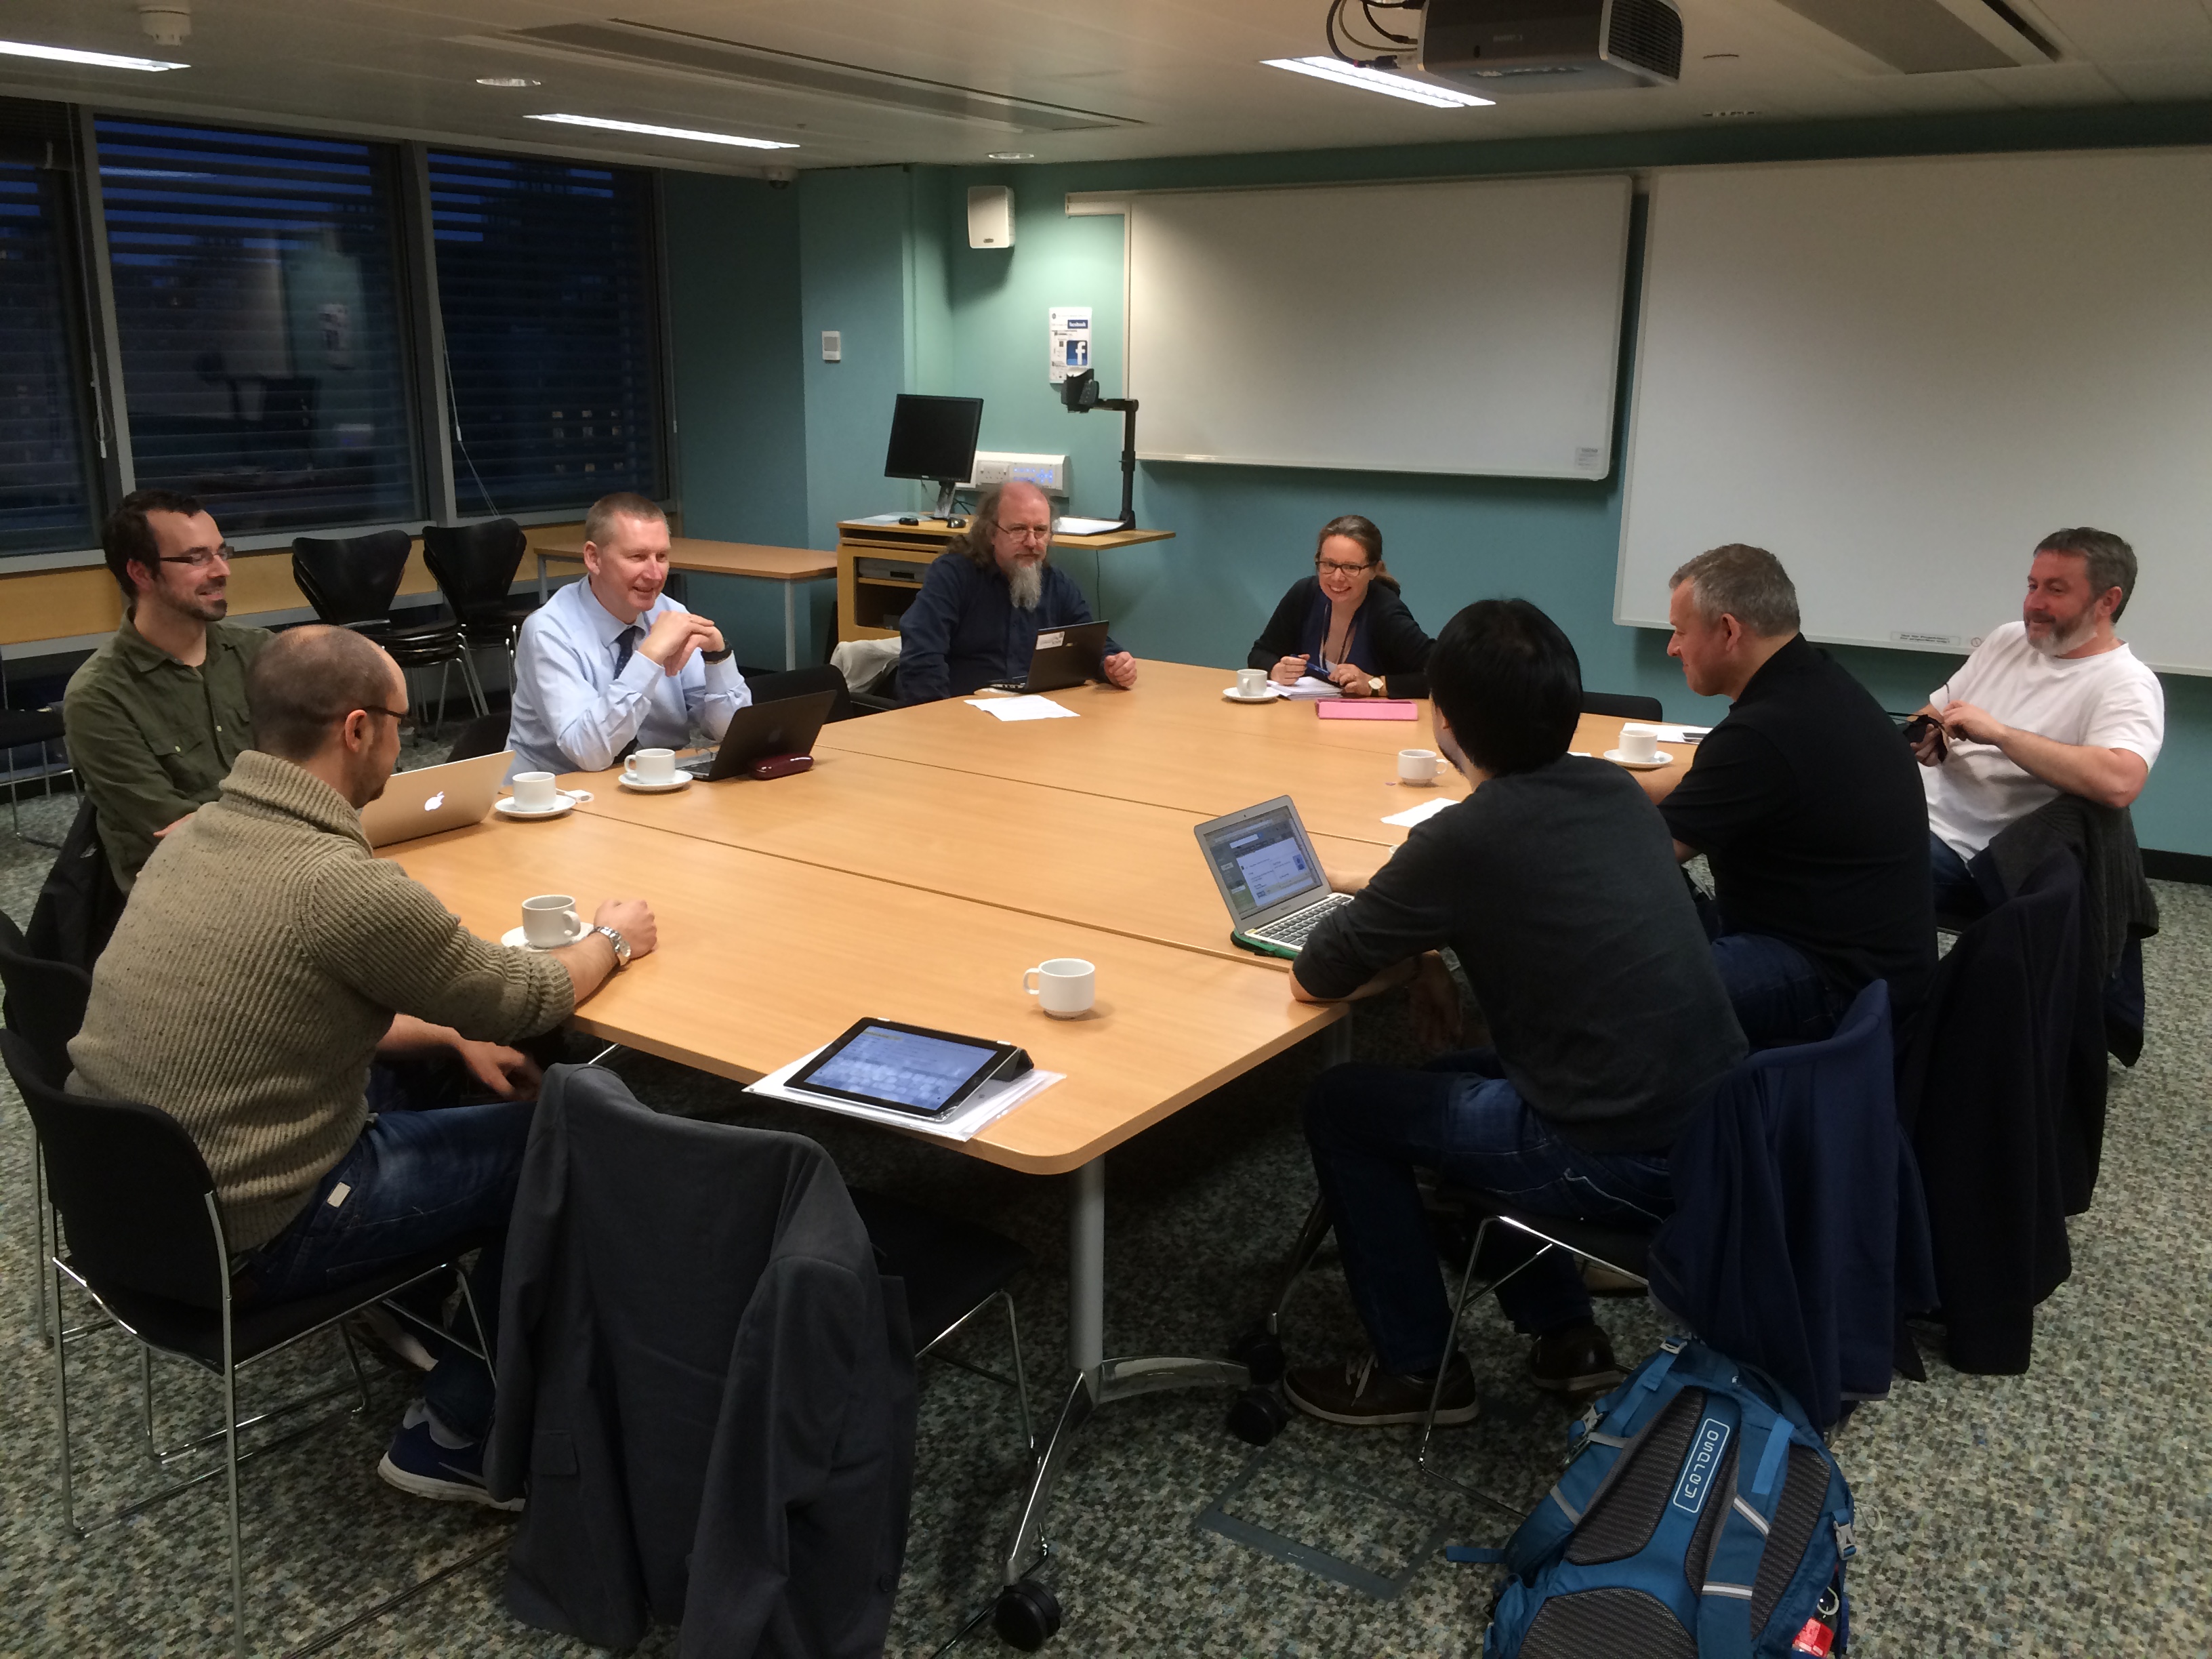
Last week I attended the 4th HSS Digital Day of Ideas 2015. Amongst networking and some interesting presentations on the use of digital technologies in humanities research (the two presentations I attended focused on analysis and visualisation of historical records), I attended the hands-on `Data Visualisation with D3′ workshop run by Uta Hinrichs, which I thoroughly enjoyed.

The workshop was a crash course to start visualising data combining d3.js and leaflet.js libraries, with HTML, SVG, and CSS. For this, we needed to have installed a text editor (e.g. Notepad++, TextWrangler) and a server environment for local development (e.g. WAMP, MAMP). With the software installed beforehand, I was ready to script as soon as I got there. We were recommended to use Chrome (or Safari), for it seems to work best for JavaScript, and the developer tools it offers are pretty good.

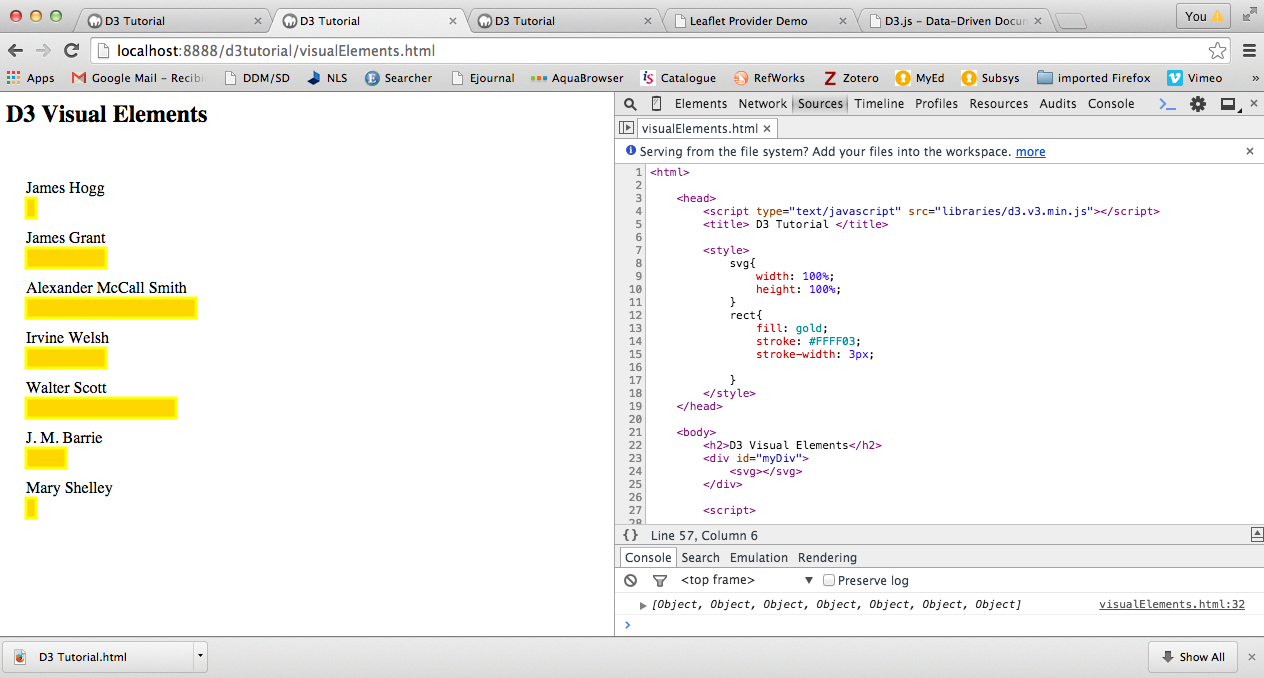
First, we started with the basics of how the d3.js library and other JavaScript libraries, such as jquery or leaflet, are incorporated into basic HTML pages. D3 is an open source library developed by Mike Bostocks. All the ‘visualisation magic’ happens in the browser, which takes the HTML file and processes the scripts as displayed in the console. The data used in the visualisation is pulled into the console, thus you cannot hide the data.

For this visualisation (D3 Visual Elements), the browser uses the content of the HTML file to call the d3.js library and the data into the console. In this example, the HTML contains a bit of CSS and SVG (Scalable Vector Graphics) element with a d3.js script which pulls data from a CSV file containing the details: author and number of books. The visualisation displays the authors’ names and bars representing the number of books each author has written. The bars change colour and display the number of books when you hover over.

Visualising CSV data with D3 JavaScript library

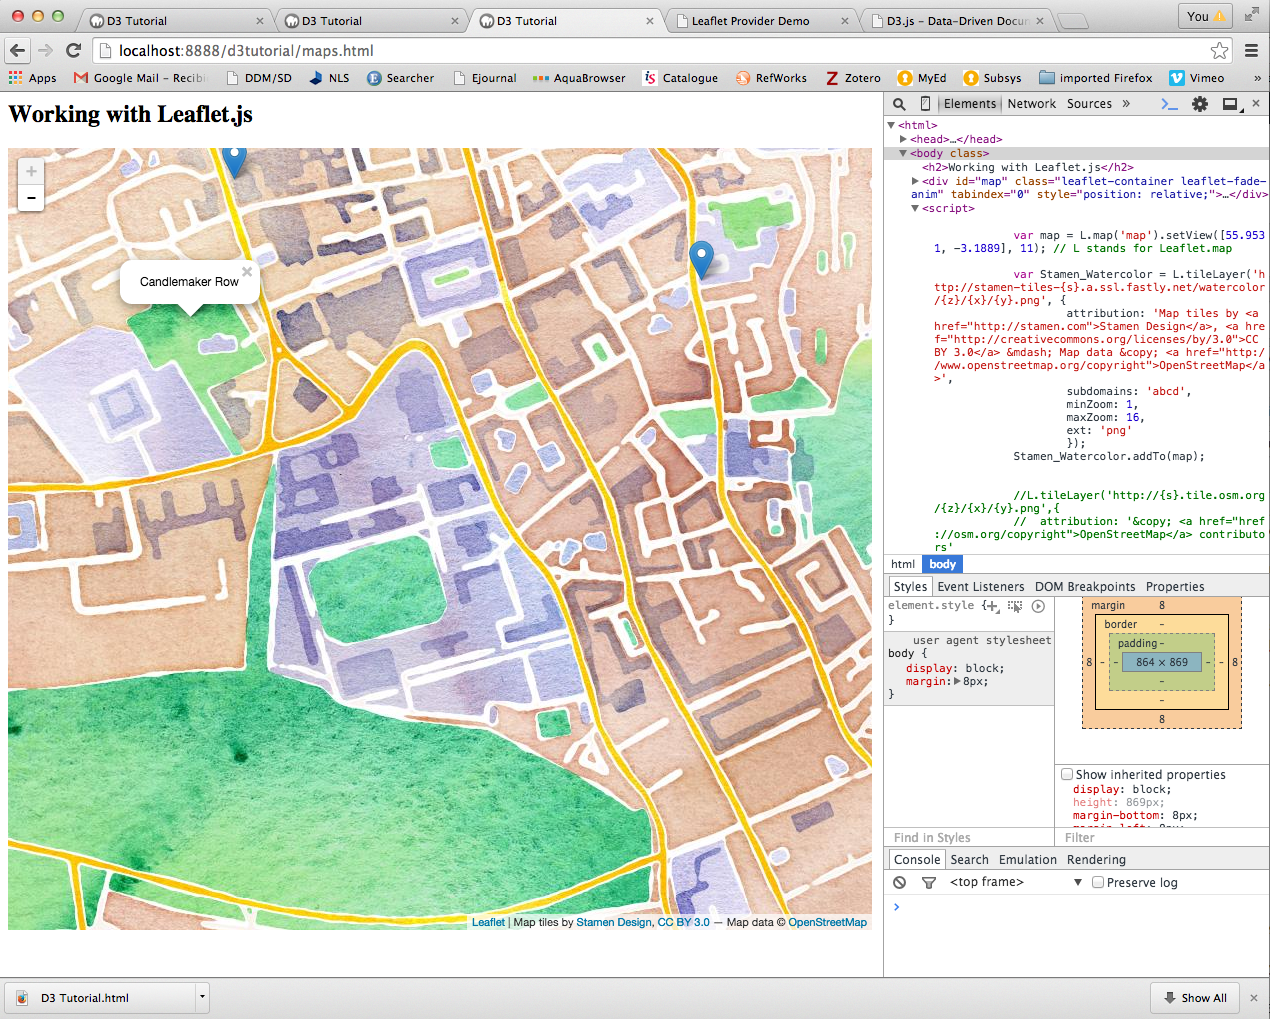
The second visualisation we worked on was the combination of geo-referenced data and leaflet.js library. Here, we combine the d3.js and leaflet.js libraries to display geographic data from a CSV file. First we ensured the OpenStreetMap loaded, then pulled the CSV data in and last customised the map using a different map tile. We also added data points to the map and pop-up tags.

Visualising CSV data using leaflet JavaScript library

In this 2-hour workshop, Uta Hinrichs managed to give a flavour of the possibilities that JavaScript libraries offer and how ‘relatively easy’ it is to visualise data online.

Workshop links:

Other links:

Rocio von Jungenfeld
EDINA and Data Library

Sustainable software for research

In an earlier blog post (October 2013) Stuart Lewis discussed the 4 aspects of software preservation as detailed in a paper by Matthews et al, A Framework for Software Preservation, namely:

      1. Storage: is the software stored somewhere?


      2. Retrieval: can the software be retrieved from wherever it is stored?


      3. Reconstruction: can the software be reconstructed (executed)?


    4. Replay: when executed, does the software produce the same results as it did originally?

It is with these thoughts in mind that colleagues (1 December 2014) from across IS (Applications Division, EDINA, Research and Learning Services, DCC, IT Infrastructure) met with Neil Chue Hong (Director of the Software Sustainability Institute) (SSI) to discuss how the University of Edinburgh could move forward on the thorny issue of software preservation.

SSI_and_IS_software meeting_dec2014

The take home message agreed by all at the meeting was that it will be easier to look after software in the future if software is managed well just now.

In terms of progressing thinking in this regard there were more questions than answers.

Matters to investigate include:

  • defining what we mean by research software: a spectrum from single R analysis scripts through to large software platforms
  • capturing descriptions of locally created research software products in the Pure Data Asset Registry
  • understanding the number of local research projects that are creating software
  • creating high-level guidance around software development and licensing (with links to SSI and OSS Watch)
  • providing skills and training for early carrer researchers (such as through the Software Carpentry initiative)
  • tools to measure software uptake/usage in local research
  • institutional use of GitLab and other software development tools
  • ascertaining instances and spend on GitHub across the University

“It’s impossible to conduct research without software, say 7 out of 10 UK researchers” or so says an SSI report surveying software generation as part of the research process in Russell Group institutions. Published in Times Higher Education (THE) the report and data that underpins the report are now available.

Much food for thought and further discussion!

Stuart Macdonald
RDM Service Coordinator

Making research ‘really reproducible’

Listening to Victoria Stodden, Assistant Professor of Statistics at Columbia University, give the keynote speech at the recent Open Repositories conference in lovely Prince Edward Island Canada, I realised we have some way to go on the path towards her idealistic vision of how to “perfect the scholarly record.”

Victoria Park, Charlottetown

Charlottetown, Prince Edward Island

As an institutional data repository manager (for Edinburgh DataShare) I often listen and talk to users about the reasons for sharing and not sharing research data. One reason, well-known to users of the UK Data Archive (now known as the UK Data Service), is if the dataset is very rich and can be used for multiple purposes beyond those for which it was created, for example, the British Social Attitudes Survey.

Another reason for sharing data, increasingly being driven by funder and publisher policies, is to allow replication of published results, or in the case of negative results which are never published, to avoid duplication of effort and wasting public monies.

It is the second reason on which Stodden focused, and not just for research data but also for the code that is run on the data to produce the scientific results. It is for this reason she and colleagues have set up the web service, Run My Code. These single-purpose datasets do not normally get added to collections within data archives and data centres, as their re-use value is very limited. Stodden’s message to the audience of institutional repository managers and developers was that the duty of preserving these artefacts of the scientific record should fall to us.

Why should underlying code and data be published and preserved along with articles as part of the scholarly record? Stodden argues, because computation is becoming central to scientific research. We’ve all heard arguments behind the “data deluge”. But Stodden persuasively focuses on the evolution of the scientific record itself, arguing that Reproducible Research is not new. It has its roots in Skepticism – developed by Robert Boyle and the Royal Society of the 1660s. Fundamentally, it’s about “the ubiquity of error: The central motivation of the scientific method is to root out error.”

In her keynote she developed this theme by expanding on the three branches of science.

  • Branch 1: Deductive. This was about maths and formal logic, and the proof as the main product of scientific endeavor.
  • Branch 2: Empirical. Statistical analysis of controlled experiments – hypothesis testing, structured communication of methods and protocols. Peer reviewed articles became the norm.
  • Branch 3: Computational. This is at an immature stage, in part because we have not developed the means to rigorously test assertions from this branch.

Stodden is scathing in her criticism of the way computational science is currently practiced, consisting of “breezy demos” at conferences that can’t be challenged or “poked at.” She argues passionately for the need to facilitate reproducibility – the ability to regenerate published results.

What is needed to achieve openness in science? Stodden argued for the need for deposit and curation of versioned data and code, with a link to the published article, and  permanence of the link.This is indeed within the territory of the repository community.

Moreover, to have sharable products at the end of a research project, one needs to plan to share from the outset. It’s very difficult to reproduce the steps to create the results as an afterthought.

I couldn’t agree more with this last assertion. Since we set up Edinburgh DataShare we have spoken to a number of researchers about their ‘legacy’ datasets which – although they would like to make them publicly available, they cannot, either because of the nature of the consent forms, the format of the material, or the lack of adequate documentation. The easiest way is to plan to share. Our Research Data Management pages have information on how to do this, including use of the Digital Curation Centre’s tool, DMPOnline.

– Robin Rice, Data Librarian