Open data repository – file size analysis

The University of Edinburgh’s open data sharing repository, DataShare, has been running since 2009.  During this time, over 125 items of research data have been published online. This blog post provides a quick overview of the the number, extent, and distribution of file sizes and file types held in the repository.

First, some high level statistics (as at March 2014):

  • Number of items: 125
  • Total number of files: 1946
  • Mean number of files per item: 16
  • Total disk space used by files: 76GB (0.074TB)

DataShare uses the open source DSpace repository platform. As well as stroring the raw data files that are uploaded, it creates derivative files such as thumbnails of images, and plain text versions of text documents such as PDF or Word files, which are then used for full-text indexing.  Of the files held within DataShare, about 80% are the original files, and 20% are derived files (including for example, licence attachments).

filetypes

When considering capacity planning for repositories, it is useful to look at the likely file size of files that may be uploaded.  Often with research data, the assumption is that the file size will be quite large.  Sometimes this can be true, but the next graph shows the distribution of files by file size.  The largest proportion of files are under 1/10th of a megabyte (100KB).  Ignoring these small files, there is a normal distribution peaking at about 100MB.  The largest files are nearer to 2GB, but there are very few of these.

filesizes

Finally, it is interesting to look at the file formats stored in the repository.  Unsurprisingly the largest number of files are plain text, followed by a number of Wave Audio files (from the Dinka Songs collection).  Other common file formats include XML files, ZIP files, and JPEG images.

fileformats

Stuart Lewis
Head of Research and Learning Services, Library & University Collections

Data provided by the DataShare team.

Data journals – an open data story

Here at the Data Library we have been thinking about how we can encourage our researchers who deposit their research data in DataShare to also submit these for peer review.

Why? We hope the impact of the research can be enhanced with the recognised added-value of peer review. Regardless whether there is a full-blown article to accompany the data.

We therefore decided recently to provide our depositors with a list of websites or organisations where they could do this.

I pulled a table together, from colleagues’ suggestions, from the PREPARDE project and the latest RDM textbook. And, very much in the Open Data spirit, I then threw the question open on Twitter:

“[..]does anyone have an up-to-date list of journals providin peer review of datasets (without articles), other than PREPARDE? #opendata

…and published the draft list for others to check or make comments on. This turned out to be a good move. The response from the Research Data Management community on Twitter was very heartening, and colleagues from across the globe provided some excellent enhancements for the list.

That process has given us confidence to remove the word ‘Draft’ from the title – the list, this crowd-sourced resource, will need to be updated from time-to-time, but we are confident that we’ve achieved reasonable coverage of the things we were looking for.

Another result of this search was the realisation that what we had gathered was in fact quite clearly a list of Data Journals. My colleague Robin Rice has now added a definition of that term to the list, and we will be providing all our depositors with a link to it:

https://www.wiki.ed.ac.uk/display/datashare/Sources+of+dataset+peer+review

Digital Scholarship Day of Ideas: Data

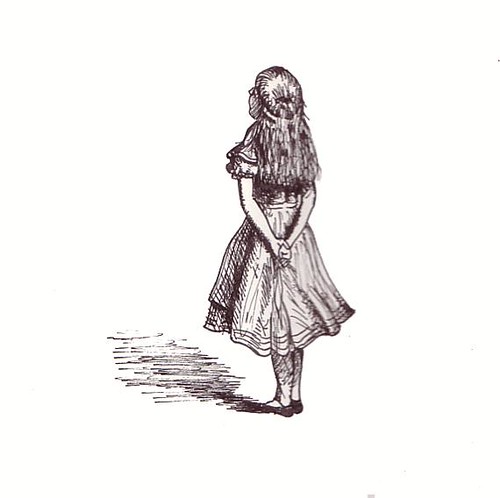
The theme of this year’s ‘Digital Scholarship Day of Ideas’ (14th May) focused on ‘data’ and what data is for the humanities and social sciences. This post summarises the presentation of Prof Annette Markham, the first speaker of the day. She started her presentation with an illustration of Alice in Wonderland. She then posed the question: What does data mean anyway?

Markham then explained how she had quit her job as a professor in order to enquire into the methods used in different disciplines. Since then, she has thought a lot about method and methodologies, and run many workshops on the theme of ‘data’. In her view, we need to be careful when using the term ‘data’ because although we think we are talking about the same thing we have different understandings of what the term actually means. So, we need to critically interrogate the word and reflect upon the methodologies.

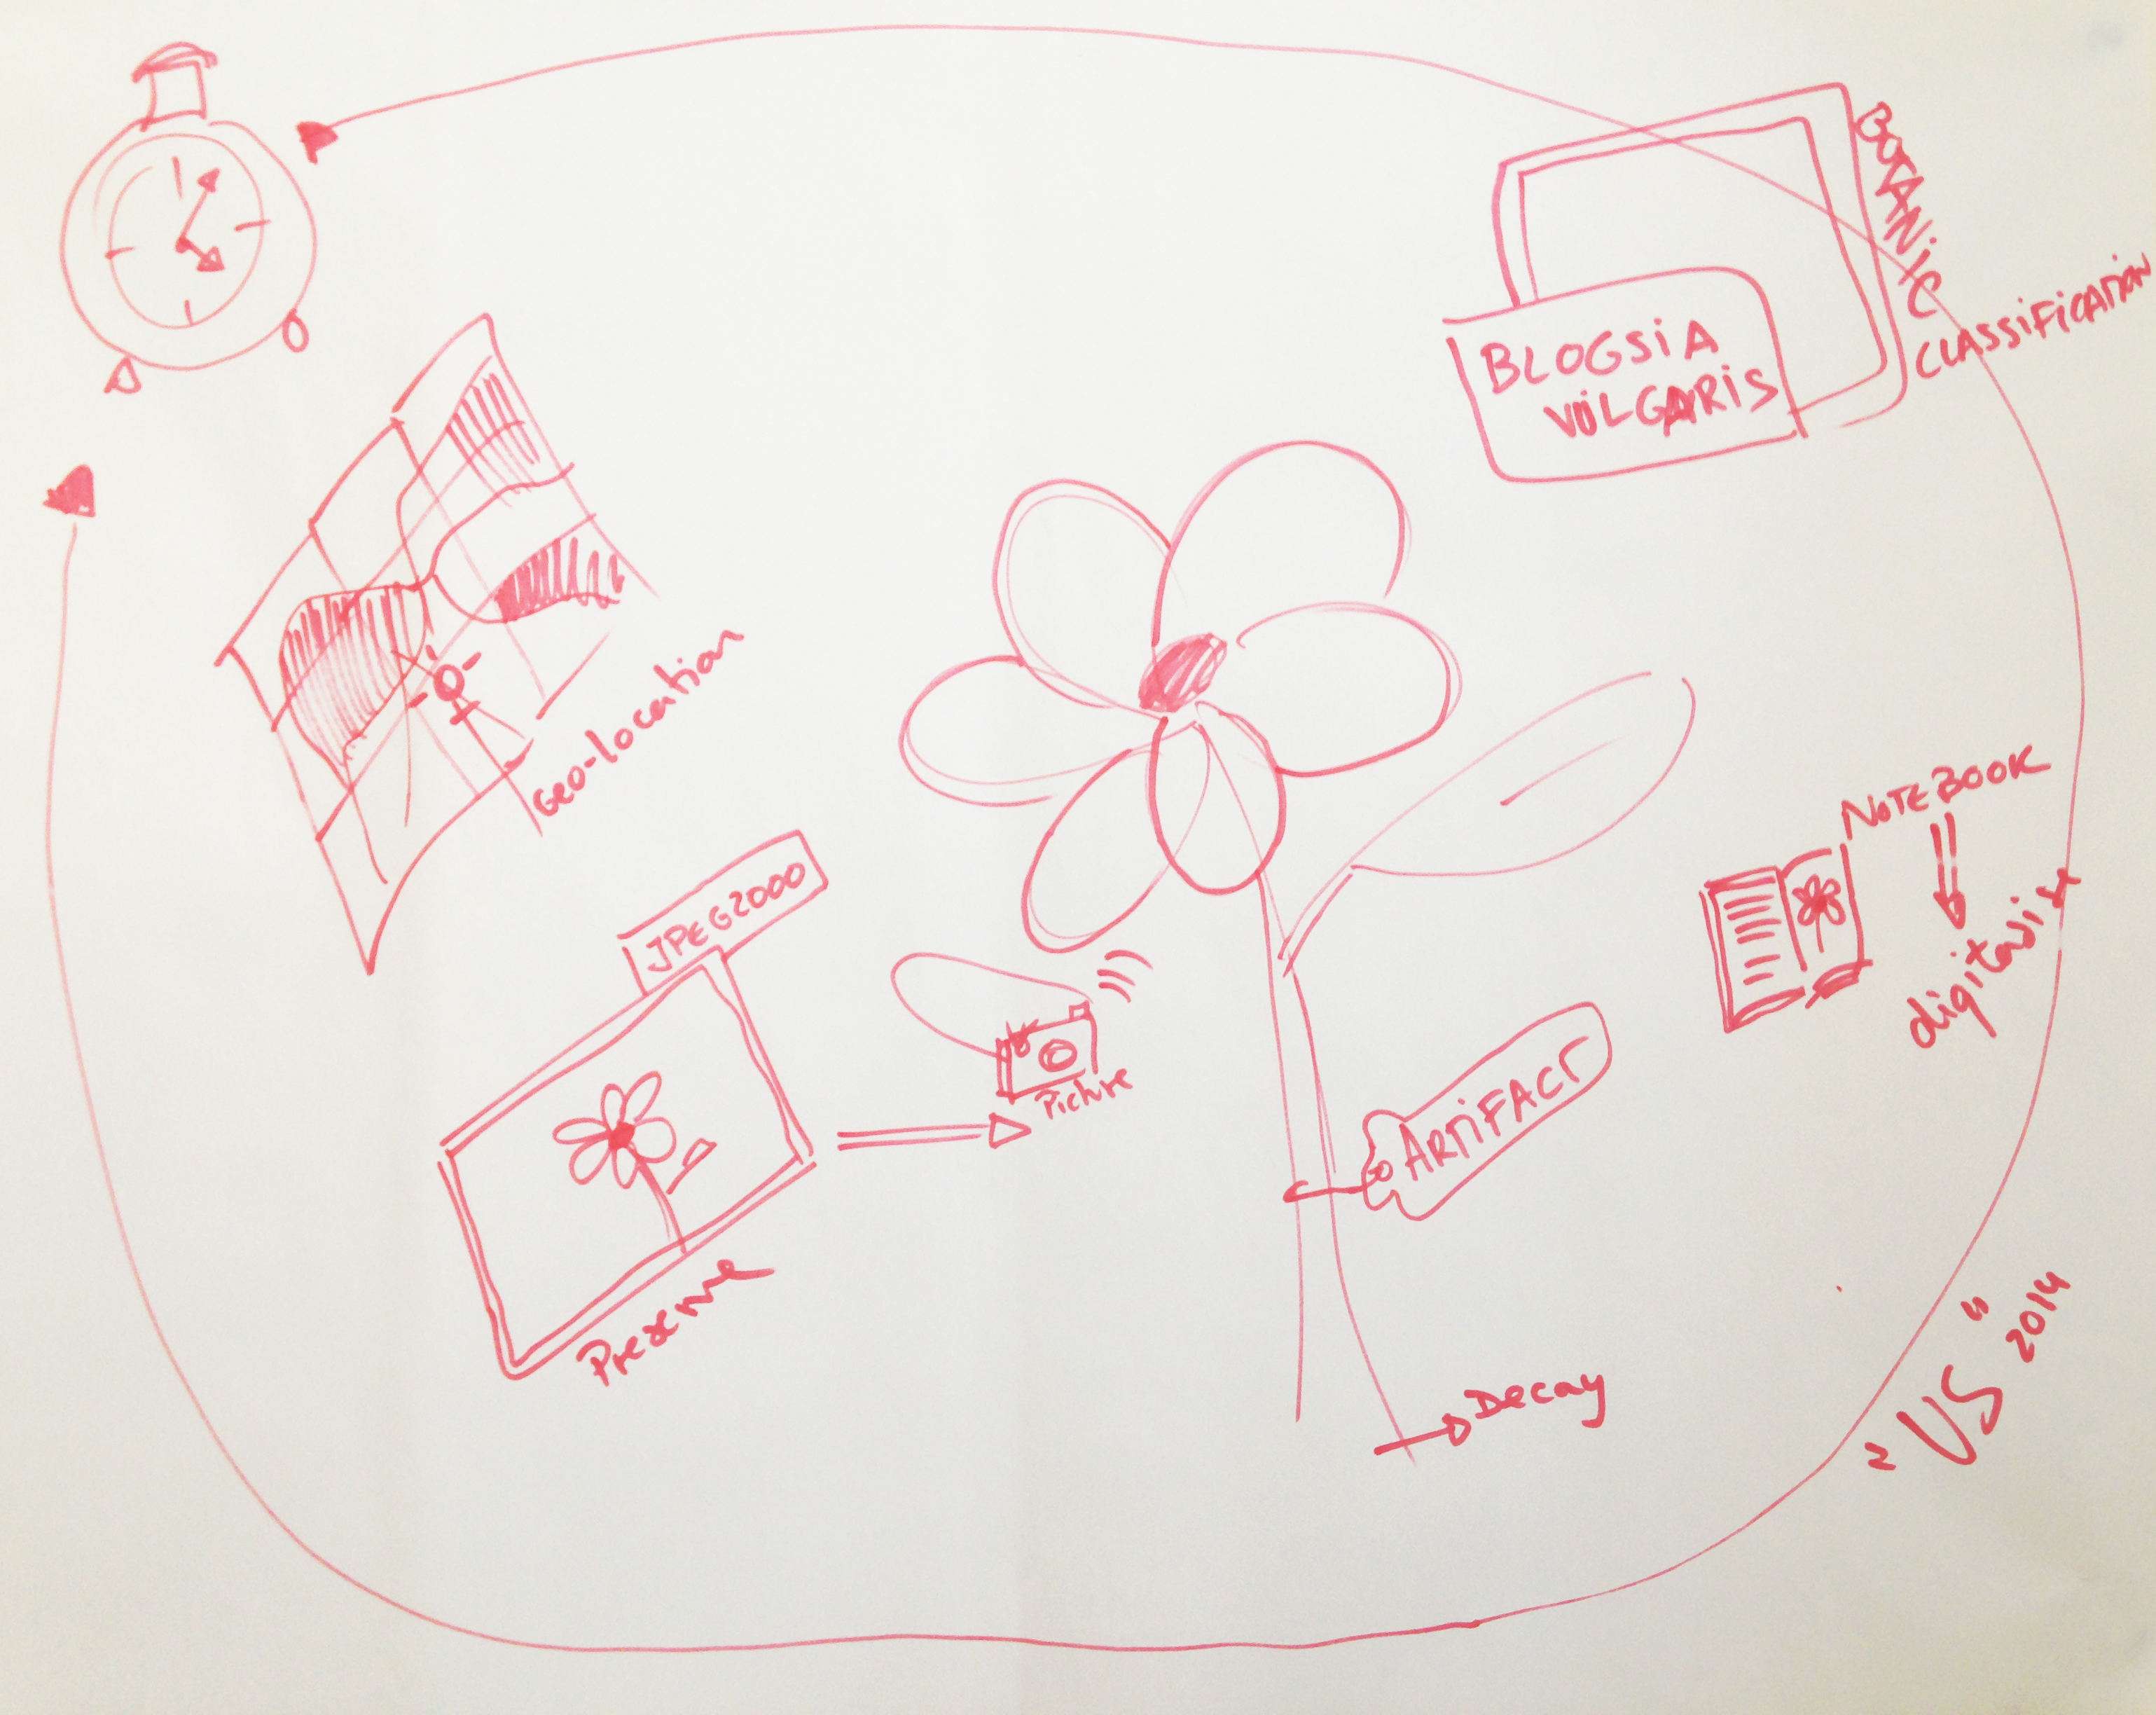
Markham talked about the need to look at ‘methods’ sideways, we need to look at them from above and below. We need to collate as many insights into these methods as possible; we might then understand what ‘data’ means for different disciplines. Sometimes, methods are related to funding, which can be an issue in the current climate, because innovative data collection procedures that might not be suitable for archival aren’t that valuable to funders. The issue is that not all research can be added to digital archives. For an ethnographer, a stain of coffee in a fieldwork notebook has meaning, but this subtle meaning cannot be archived or be meaningful to others unless digitised and clearly documented.

Drawing on Gregory Bateson’s Steps to an Ecology of Mind (1972), she asked us to think about ‘frames’ and how these draw our attention to what is inside and dismiss what lays outside. If you change the frame with which you look, it changes what you see. She showed and suggested using different frames. For example there are: traditional frames, structures like the sphere, molecular structures. Different structures afford different ways of understanding, and convey themes and ideas that are embedded within them.

Empty-framesphere-296433_1280Azithromycin_3d_structure


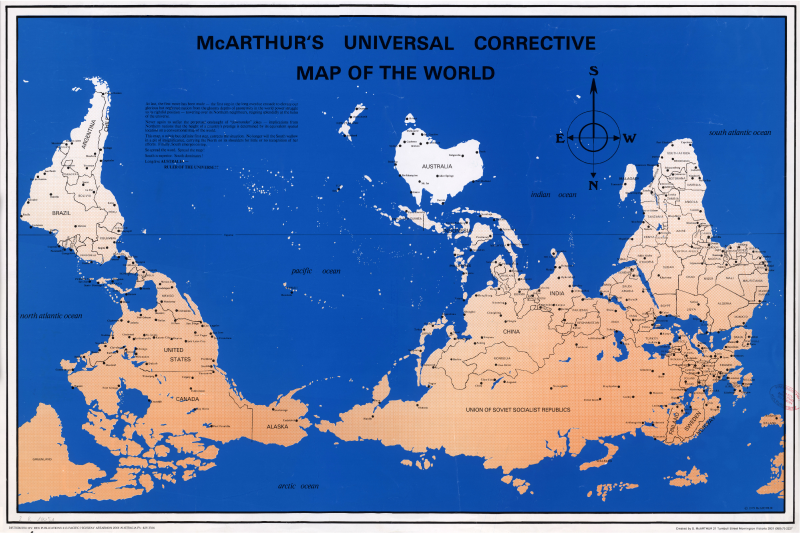
To use another example, she used an image of McArthur’s Universal Corrective Map of the World to illustrate how our understanding of our environment changes when information is shown and structured in a different and unexpected way.

  • What happens when we change the frame?
  • How does the structure shape the information and affect the way we engage with it?

Reversed Earth map 1000x500
Satellite image of McArthur’s Austral-centric view of the world [Public domain]

1. How do we frame culture and experiences in the 21st Century? How has our concept of society changed since the internet?
Continuing the discussion on frames, she spoke about how the internet has brought on a significant frame shift. This new frame has influenced the way we interact with media and data. To illustrate this, she showed work by Sparacino, Pentland, Davenport, Hlavac and Obelnicki, who in the project the ‘City of News’ (Sparacino, 1997) addressed this frame shift caused by the internet. The MIT project (1996) presented a 3D information browsing system, where buildings were the information spaces where information would be stored and retrieved. Through this example, Markham emphasized how our interaction with information and the methods we use for looking at social culture are changing, and so are the visual-technical frames we use to enquire into the world.

2. How do we frame objects and processes of enquiry?
She argued that this framing of objects and processes hasn’t changed enough. If we were to draw a picture or map of what research is and how the data in any research project is structured, we would end up with a multi-dimensional mass of connected blobs and lines instead of with a neatly composed bi-dimensional picture frame (research looks more like a molecular structure than like a rectangular frame). However, we still associate qualitative research with traditional ethnographic methods and we see quite linear and “neat and tidy” methods as legitimate. There is a need to look at new methods of collecting and analysing research ‘data’ if we are to enquire into socio-cultural changes.

3. How do we frame what counts as proper legitimate enquiry?
In order to change the frame, we have to involve the research community. The frame shift can happen, even if slowly, when established research methods are reinvented. Markham used 1960s feminist scholars as an example, for they approached their research using a frame that was previously inconceivable. This new methodological approach was based on situated knowledge production and embodied understanding, which challenged the way in which scientific research methods had been operating (more on the subject, (Haraway 1988). But in the last decade at least we are seeing an upsurge of to scientific research methods – evidence based, problem solving approaches – dominating the funding and media understanding of research.

So, what is DATA?
‘Data’ is often an easy term to toss around, as it stands for unspecified stuff. Ultimately, ‘data’ is “a lot of highly specific but unspecified stuff”, that we use to make sense of the world around us, a phenomenon. The term ‘data’ is a arguably quite a powerfully rhetorical word in humanities and social sciences, in that it shapes what we see and what we think.

The term data comes from the Latin verb dare, to give. In light of this, ‘data’ is something that is already given in the argument – pre-analytical and pre-semantics. Facts and arguments might have theoretical underpinnings, but data is devoid of any theoretical value. Data is everywhere. Markham referring to Daniel Rosenberg‘s paper ‘Data before the fact’, pointed out that facts can be proved wrong, and then they are no longer a facts, but data is always data even when proven wrong. In the 80s, she was trained not to use the term ‘data,’ they said:

“we do not use it, we collect material, artifacts, notes, information…”

Data is conceived as something that is discrete, identifiable, disconnected. The issue, she said was that ‘data’ poorly represents a conversation (gesture and embodiment), the emergence of meaning from non verbal information, because when we extract things from their context and then use them as a stand-alone ‘data’, we loose a wealth of information.

Markham then showed two ads (Samsung Galaxy SII and Global Pulse) to illustrate her concerns about life becoming data-fied. She referenced Kate Crawford’s perspective on “big data fundamentalism”, because not all human experiences can be reduced to big data, to digital signals, to data points. We have to trouble the idea of thinking about “humans (and their data) as data”. We don’t understand data as it is happening, and “data has never been raw”. Data is always filtered, transformed. We need to use our strong and robust methods of enquery, and that these do not necessarily focus on data as the centre stage, it may be about understanding the phenomenon of what we have made,this thing called data. We have to remember that that’s possible.

Data functions very powerfully as a term, and from a methodological perspective it creates a very particular frame. It warrants careful consideration, especially in an era where the predominant framework is telling us that data is really the important part of research.

References

  • Image of Alice in Wanderland after original illustration by Danny Pig (CC BY-SA 2.0)
  • Sparacino, Flavia, A. Pentland, G. Davenport, M. Hlavac and M. Obelnicki (1997). ‘City of News’ in Proceedings of Ars Electronica Festival, Linz, Austria, 8-13 Sep.
  • Bateson, Gregory (1972). Steps to an ecology of mind: collected essays in anthropology, psychiatry, evolution, and epistemology. Aylesbury: Intertext.
  • Frame by Hubert Robert [Public domain], via Wikimedia Commons
  • Sphere by anonymous (CC 1.0) [Public Domain]
  • Image of 3D structure (CC BY-SA 3.0)
  • Map by Poulpy, from work by jimht[at]shaw[dot]ca, modified by Rodrigocd, from Image Earthmap1000x500compac.jpg, [Public domain], via Wikimedia Commons
  • Rosenberg, Daniel (2013). ‘Data before the fact’ in Lisa Gitelman (ed.) “Raw data” is an oxymoron. Cambridge, Mass.: MIT Press, pp. 15–40.

More about

Rocio von Jungenfeld
Data Library Assistant

Non-standard research outputs

I recently attended (13th May 2014) the one-day ‘Non-standard Research Outputs’ workshop at Nottingham Trent University.

[ 1 ] The day started with Prof Tony Kent and his introduction to some of the issues associated with managing and archiving non-text based research outputs. He posed the question: what uses do we expect these outcomes to have in the future? By trying to answer this question, we can think about the information that needs to be preserved with the output and how to preserve both, output and its documentation. He distinguished three common research outcomes in arts-humanities research contexts:

  • Images. He showed us an image of a research output from a fashion design researcher. The issue with research outputs like this one is that they are not always self explanatory, and quite often open up the question of what is recorded in the image, and what the research outcome actually is. In this case, the image contained information about a new design for a heel of a shoe, but the research outcome itself, the heel, wasn’t easily identifiable, and without further explanation (description metadata), the record would be rendered unusable in the future.
  • Videos. The example used to explain this type of non-text based research output was a video featuring some of the research of Helen Storey. The video contains information about the project Wonderland and how textiles dissolve in water and water bottles disintegrate. In the video, researchers explain how creativity and materials can be combined to address environmental issues. Videos like this one contain both, records of the research outcome in action (exhibition) and information about what the research outcome is and how the project ideas developed. These are very valuable outcomes, but they contain so much information that it’s difficult to untangle what is the outcome and what is information about the outcome.

  • Statements. Drawing from his experience, he referred to researchers in fashion and performance arts to explain this research outcome, but I would say it applies to other researchers in humanities and artistic disciplines as well. The issue with these research outcomes is the complexity of the research problems the researchers are addressing and the difficulty of expressing and describing what their research is about, and how the different elements that compose their research project outcomes interact with each other. How much text do we need to understand non-text-based research outcomes such as images and videos? How important is the description of the overall project to understand the different research outcomes?

Other questions that come to mind when thinking about collecting and archiving non-standard research outputs such as exhibitions are: ‘what elements of the exhibition do we need to capture? Do we capture the pieces exhibited individually or collectively? How can audio/visual documentation convey the spatial arrangements of these pieces and their interrelations? What exactly constitutes the research outputs? Installation plans, cards, posters, dresses, objects, images, print-outs, visualisations, visitors comments, etc.? We also discussed how to structure data in a repository for artefacts that go into different exhibitions and installations. How to define a practice-based research output that has a life in its own? How do we address this temporal element, the progression and growth of the research output? This flowchart might be useful. Shared with permission of James Toon and collaborators.

Non-standard_research_outputs

Sketch from group discussion about artefacts and research practices that are ephemeral. How to capture the artefact as well as spatial information, notes, context, images, etc.

[ 2 ] After these first insights into the complexity of what non-standard research outcomes are, Stephanie Meece from the University of the Arts London (UAL) discussed her experience as institutional manager of the UAL repository. This repository is for research outputs, but they have also set up another repository for research data which is currently not publicly available. The research output repository has thousands of deposits, but the data repository has ingested only one dataset in its first two months of existence. The dataset in question is related to a media-archaeology research project where a number of analogue-based media (tapes) are being digitised. This reinforced my suspicion that researchers in the arts and humanities are ready and keen to deposit final research outputs, but are less inclined to deposit their core data, the primary sources from which their research outputs derive.

The UAL learned a great deal about non-standard research outputs through the KULTUR project, a Jisc funded project focused on developing repository solutions for the arts. Practice-based research methods engage with theories and practices in a different way than more traditional research methods. In their enquiries about specific metadata for the arts, the KULTUR project identified that metadata fields like ‘collaborators’ were mostly applicable to the arts (see metadata report, p. 25), and that this type of metadata fields differed from ‘data creator’ or ‘co-author.’ Drawing from this, we should certainly reconsider the metadata fields as well as the wording we use in our repositories to accommodate the needs of researchers in the arts.

Other examples of institutional repositories for the arts shown were VADS (University of the Creative Arts) and RADAR (Glasgow School of Art).

[ 3 ] Afterwards, Bekky Randall made a short presentation in which she explained that non-standard research outputs have a much wider variety of formats than standard text-based outputs. She also explained the importance of getting the researchers to do their own deposits, as they are the ones that know the information required for metadata fields. Once researchers find out what is involved in depositing their research, they will be more aware of what is needed, and get involved earlier with research data management (RDM). This might involve researchers depositing throughout the whole research project instead of at the end when they might have forgotten much of the information related to their files. Increasingly, research funders require data management plans, and there are tools to check what they expect researchers to do in terms of publication and sharing. See SHERPA for more information.

[ 4 ] The presentation slot after lunch is always challenging, but Prof Tom Fisher kept us awake with his insights into non-standard research outcomes. In the arts and humanities it’s sometimes difficult to separate insights from the data. He opened up the question of whether archiving research is mainly for Research Excellence Framework (REF) purposes. His point was to delve into the need to disseminate, access and reuse research outputs in the arts beyond REF. He argued that current artistic practice relates more to the present context (contemporary practice-based research) than to the past. In my opinion, arts and humanities always refer to their context but at the same time look back into the past, and are aware they cannot dismiss the presence of the past. For that reason, it seems relevant to archive current research outputs in the arts, because they will be the resources that arts and humanities researchers might want to use in the future.

He spent some time discussing the Journal for Artistic Research (JAR). This journal was designed taking into account the needs of artistic research (practice-based methodologies and research outcomes in a wide range of media), which do not lend themselves to the linearity of text-based research. The journal is peer-review and this process is made as transparent as possible by publishing the peer-reviews along with the article. Here is an example peer-review of an article submitted to JAR by ECA Professor Neil Mulholland.

[ 5 ] Terry Bucknell delivered a quick introduction to figshare. In his presentation he explained the origins of the figshare repository, and how the platform has improved its features to accommodate non-standard research outputs. The platform was originally thought for sharing scientific data, but has expanded its capabilities to appeal to all disciplines. If you have an ORCID account you can now connect it to figshare.

[ 6 ] The last presentation of the day was delivered by Martin Donnelly from the Digital Curation Centre (DCC) who gave a refreshing view into data management for the arts. He pointed out the issue of a scientifically-centred understanding of research data management, and that in order to reach the arts and humanities research community, we might need to change the wording, and change the word ‘data’ for ‘stuff’ when referring to creative research outputs. This reminded me of the paper ‘Making Sense: Talking Data Management with Researchers’ by Catharine Ward et al. (2011) and the Data Curation Profiles that Jane Furness, Academic Support Librarian, created after interviewing two researchers at Edinburgh College of Art, available here.

Quoting from his slides “RDM is the active management and appraisal of data over all the lifecycle of scholarly research.” In the past, data in the sciences was not curated or taken care of after the publication of articles; now this process has changed and most science researchers already actively manage their data throughout the research project. This could be extended to arts and humanities research. Why wait to do it at the end?

The main argument for RDM and data sharing is transparency. The data is available for scrutiny and replication of findings. Sharing is most important when events cannot be replicated, such as performance or a census survey. In the scientific context ‘data’ stands for evidence, but in the arts and humanities this does not apply in the same way. He then referred to the work of Leigh Garrett, and how data gets reused in the arts. Researchers in the arts reuse research outputs but there is the fear of fraud, because some people might not acknowledge the data sources from which their work derives. To avoid this, there is the tendency to have longer embargoes in humanities and arts than in sciences.

After Martin’s presentation, we called it a day. While, waiting for my train at Nottingham Station, I noticed I had forgotten my phone (and the flower sketch picture with it), but luckily Prof Tony Kent came to my rescue, and brought the phone to the station. Thanks to Tony and Off-Peak train tickets, I was able to travel back home on the day.

Rocio von Jungenfeld
Data Library Assistant