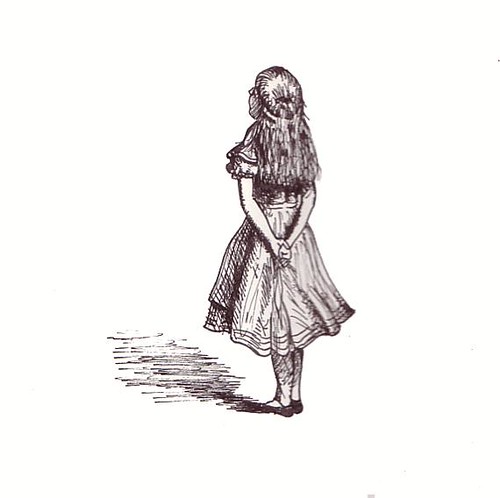
The theme of this year’s ‘Digital Scholarship Day of Ideas’ (14th May) focused on ‘data’ and what data is for the humanities and social sciences. This post summarises the presentation of Prof Annette Markham, the first speaker of the day. She started her presentation with an illustration of Alice in Wonderland. She then posed the question: What does data mean anyway?
 Markham then explained how she had quit her job as a professor in order to enquire into the methods used in different disciplines. Since then, she has thought a lot about method and methodologies, and run many workshops on the theme of ‘data’. In her view, we need to be careful when using the term ‘data’ because although we think we are talking about the same thing we have different understandings of what the term actually means. So, we need to critically interrogate the word and reflect upon the methodologies.
Markham talked about the need to look at ‘methods’ sideways, we need to look at them from above and below. We need to collate as many insights into these methods as possible; we might then understand what ‘data’ means for different disciplines. Sometimes, methods are related to funding, which can be an issue in the current climate, because innovative data collection procedures that might not be suitable for archival aren’t that valuable to funders. The issue is that not all research can be added to digital archives. For an ethnographer, a stain of coffee in a fieldwork notebook has meaning, but this subtle meaning cannot be archived or be meaningful to others unless digitised and clearly documented.
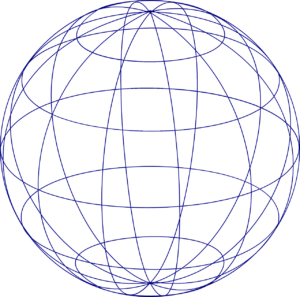
Drawing on Gregory Bateson’s Steps to an Ecology of Mind (1972), she asked us to think about ‘frames’ and how these draw our attention to what is inside and dismiss what lays outside. If you change the frame with which you look, it changes what you see. She showed and suggested using different frames. For example there are: traditional frames, structures like the sphere, molecular structures. Different structures afford different ways of understanding, and convey themes and ideas that are embedded within them.


To use another example, she used an image of McArthur’s Universal Corrective Map of the World to illustrate how our understanding of our environment changes when information is shown and structured in a different and unexpected way.
- What happens when we change the frame?
- How does the structure shape the information and affect the way we engage with it?

Satellite image of McArthur’s Austral-centric view of the world [Public domain]
1. How do we frame culture and experiences in the 21st Century? How has our concept of society changed since the internet?
Continuing the discussion on frames, she spoke about how the internet has brought on a significant frame shift. This new frame has influenced the way we interact with media and data. To illustrate this, she showed work by Sparacino, Pentland, Davenport, Hlavac and Obelnicki, who in the project the ‘City of News’ (Sparacino, 1997) addressed this frame shift caused by the internet. The MIT project (1996) presented a 3D information browsing system, where buildings were the information spaces where information would be stored and retrieved. Through this example, Markham emphasized how our interaction with information and the methods we use for looking at social culture are changing, and so are the visual-technical frames we use to enquire into the world.
2. How do we frame objects and processes of enquiry?
She argued that this framing of objects and processes hasn’t changed enough. If we were to draw a picture or map of what research is and how the data in any research project is structured, we would end up with a multi-dimensional mass of connected blobs and lines instead of with a neatly composed bi-dimensional picture frame (research looks more like a molecular structure than like a rectangular frame). However, we still associate qualitative research with traditional ethnographic methods and we see quite linear and “neat and tidy” methods as legitimate. There is a need to look at new methods of collecting and analysing research ‘data’ if we are to enquire into socio-cultural changes.
3. How do we frame what counts as proper legitimate enquiry?
In order to change the frame, we have to involve the research community. The frame shift can happen, even if slowly, when established research methods are reinvented. Markham used 1960s feminist scholars as an example, for they approached their research using a frame that was previously inconceivable. This new methodological approach was based on situated knowledge production and embodied understanding, which challenged the way in which scientific research methods had been operating (more on the subject, (Haraway 1988). But in the last decade at least we are seeing an upsurge of to scientific research methods – evidence based, problem solving approaches – dominating the funding and media understanding of research.
So, what is DATA?
‘Data’ is often an easy term to toss around, as it stands for unspecified stuff. Ultimately, ‘data’ is “a lot of highly specific but unspecified stuff”, that we use to make sense of the world around us, a phenomenon. The term ‘data’ is a arguably quite a powerfully rhetorical word in humanities and social sciences, in that it shapes what we see and what we think.
The term data comes from the Latin verb dare, to give. In light of this, ‘data’ is something that is already given in the argument – pre-analytical and pre-semantics. Facts and arguments might have theoretical underpinnings, but data is devoid of any theoretical value. Data is everywhere. Markham referring to Daniel Rosenberg‘s paper ‘Data before the fact’, pointed out that facts can be proved wrong, and then they are no longer a facts, but data is always data even when proven wrong. In the 80s, she was trained not to use the term ‘data,’ they said:
“we do not use it, we collect material, artifacts, notes, information…”
Data is conceived as something that is discrete, identifiable, disconnected. The issue, she said was that ‘data’ poorly represents a conversation (gesture and embodiment), the emergence of meaning from non verbal information, because when we extract things from their context and then use them as a stand-alone ‘data’, we loose a wealth of information.
Markham then showed two ads (Samsung Galaxy SII and Global Pulse) to illustrate her concerns about life becoming data-fied. She referenced Kate Crawford’s perspective on “big data fundamentalism”, because not all human experiences can be reduced to big data, to digital signals, to data points. We have to trouble the idea of thinking about “humans (and their data) as data”. We don’t understand data as it is happening, and “data has never been raw”. Data is always filtered, transformed. We need to use our strong and robust methods of enquery, and that these do not necessarily focus on data as the centre stage, it may be about understanding the phenomenon of what we have made,this thing called data. We have to remember that that’s possible.
Data functions very powerfully as a term, and from a methodological perspective it creates a very particular frame. It warrants careful consideration, especially in an era where the predominant framework is telling us that data is really the important part of research.
References
- Image of Alice in Wanderland after original illustration by Danny Pig (CC BY-SA 2.0)
- Sparacino, Flavia, A. Pentland, G. Davenport, M. Hlavac and M. Obelnicki (1997). ‘City of News’ in Proceedings of Ars Electronica Festival, Linz, Austria, 8-13 Sep.
- Bateson, Gregory (1972). Steps to an ecology of mind: collected essays in anthropology, psychiatry, evolution, and epistemology. Aylesbury: Intertext.
- Frame by Hubert Robert [Public domain], via Wikimedia Commons
- Sphere by anonymous (CC 1.0) [Public Domain]
- Image of 3D structure (CC BY-SA 3.0)
- Map by Poulpy, from work by jimht[at]shaw[dot]ca, modified by Rodrigocd, from Image Earthmap1000x500compac.jpg, [Public domain], via Wikimedia Commons
- Rosenberg, Daniel (2013). ‘Data before the fact’ in Lisa Gitelman (ed.) “Raw data” is an oxymoron. Cambridge, Mass.: MIT Press, pp. 15–40.
More about
Rocio von Jungenfeld
Data Library Assistant


