DataShare Spotlight: A photographic record of a divided Berlin in the 1980’s

Some of the most widely used datasets in DataShare are the collections of photographs of tower blocks and mass housing, both in the UK and internationally, created by Miles Glendinning, Professor of Architectural Conservation in the Edinburgh School of Architecture and Landscape Architecture (ESALA). Recently, Miles deposited a number of new datasets to the DOCOMOMO International Mass Housing Archive collection, including recent research data-gathering exercises in Belgium, China, Chile, Italy and Morocco. Further to this, are two archives of photos documenting Berlin in the 1980’s. Covering both East and West Berlin, these images provide striking visual representations of the buildings, transport infrastructure and general urban environment of the time, revealing a fascinating glimpse into the DDR (Deutsche Demokratische Republik), the BRD (Bundesrepublik Deutschland) and the enforced division between them.

To help shine a light on this special set of images, I asked Miles to answer three questions regarding the creation of this dataset.

Mitte - Friedrichstrasse. (Nord-Sud S-Bahn), Sept 1982

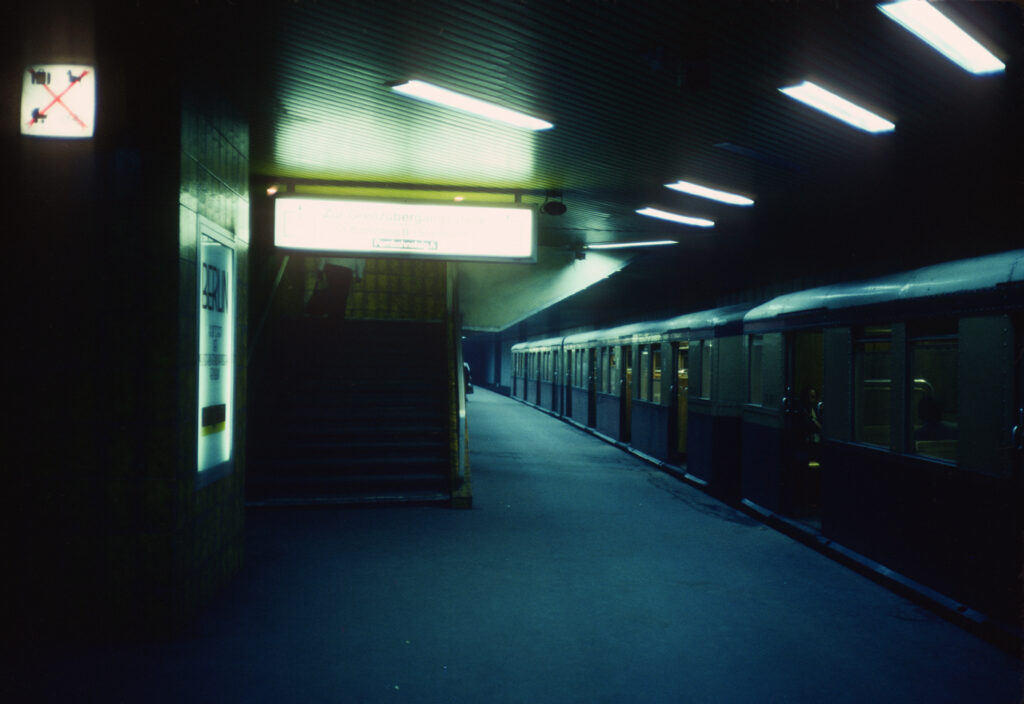
Mitte – Friedrichstrasse. (Nord-Sud S-Bahn), Sept 1982 Photo credit: Miles Glendinning https://doi.org/10.7488/ds/8062

1 – What drew you to Berlin during this period?

I was drawn to visit East and West Berlin in 1982 by a curiosity to see first-hand what the Wall was like in its ‘mature’ state, and to experience, however briefly, the contrasting ways of life in the two parts of the city – East Berlin a would-be capital city with an alien entity adjoining its city core, and West Berlin a somewhat peaceful, even backwater-like island city-state divorced from the mainstream hubbub of West German life: at that stage, in the pre-Gorbachev era, there was no suspicion that the Iron Curtain only had a few more years of life, and the situation all seemed irreversibly settled in a strange sort of stagnant air immobility.

What particularly interested me were the quirky anomalies thrown up by the makeshift character of the division-line, including strange ‘exclaves’ such as Steinstücken – a few houses accessible by its own bus route through a narrow extrusion in the Wall), and the strange status of the S-Bahn (the local suburban rail network), whose lines in West Berlin were run indirectly by the DDR authorities, and had fallen into seemingly terminal decay and dereliction following many years of boycotts by West Berliners.

Several S-Bahn stations also featured bizarre border anomalies, such as the ‘door in the Wall’ that gave access to Wollankstraße station, and the underground/overground West-Berlin interchange and border crossing in the centre of East Berlin at Friedrichstraße.

Other infrastructural monuments of division and decay included the enormous DDR customs checkpoints complex newly built just north of ‘Checkpoint Charlie’, and later demolished immediately in 1990, or the disused Olympic Stadium bequeathed by the Nazi regime.

Gesundbrunnen station in Sept 1982

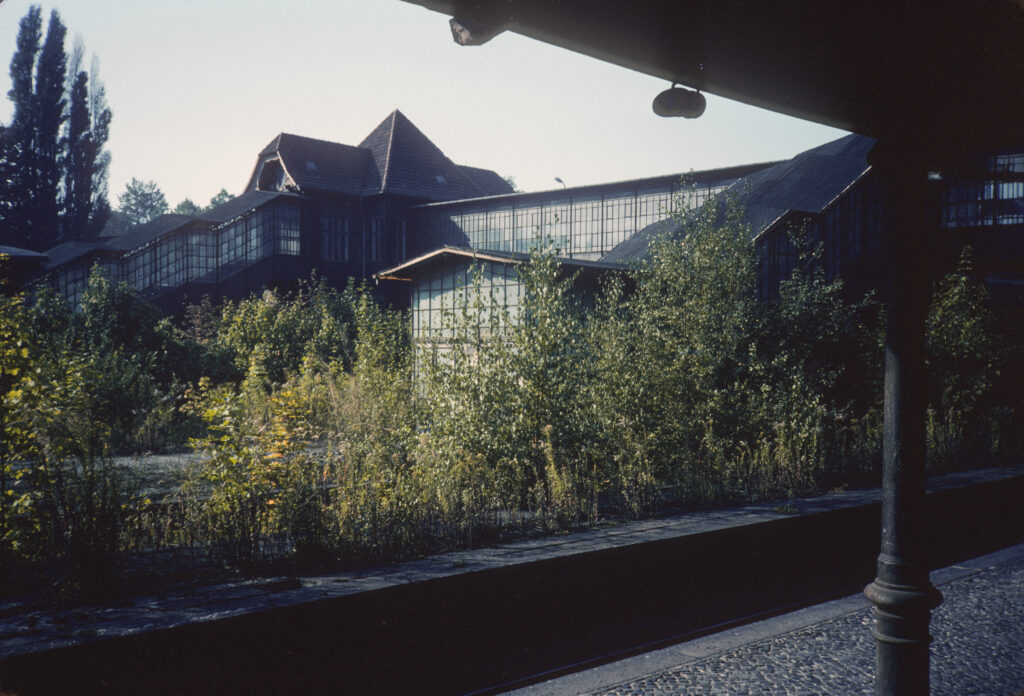
Wedding – Bf Gesundbrunnen – Sept 1982 view A – Photo credit: Miles Glendinning https://doi.org/10.7488/ds/8063

2 – Your images are documented with metadata of where they were taken, but beyond that, does looking at any of the photos bring back any particular memories?

The strongest memory brought back by looking at the photos is the sense of ‘suspended animation’ that was pervasive throughout the city, with some bustle in the ‘Ku’damm’ and ‘Alex’, but significant areas of dereliction and disuse everywhere, especially near the border, plus stereotypical ‘communist greyness’ throughout East Berlin, and a general feeling of relative lack of population and urban energy in both halves of the city.

The images of quiet decay and dereliction seem to evoke feelings akin to the ‘deploratio urbis’, or lamentation for lost greatness, felt by Renaissance and Romantic visitors among the ruins of classical Rome: looking at a 1982 photo such as that of the spectacularly overgrown wasteland of Gesundbrunnen station, what one saw was a vista of apparently irreversible decay, with no hint of the spectacular reversal that lay only a decade ahead.

From a modernist heritage perspective, however, many of the structures built during the division today seem of growing historical interest, including West-Berlin’s outer modern social housing complexes such as the Märkisches Viertel, or the extensive ‘Plattenbau’ complexes ubiquitous throughout East Berlin (on which see also the more recent images in the Docomomo International Mass Housing Archive, https://datashare.ed.ac.uk/handle/10283/2927 ).

Kreuzberg - Friedrichstrasse, Checkpoint Charlie, Sept 1982

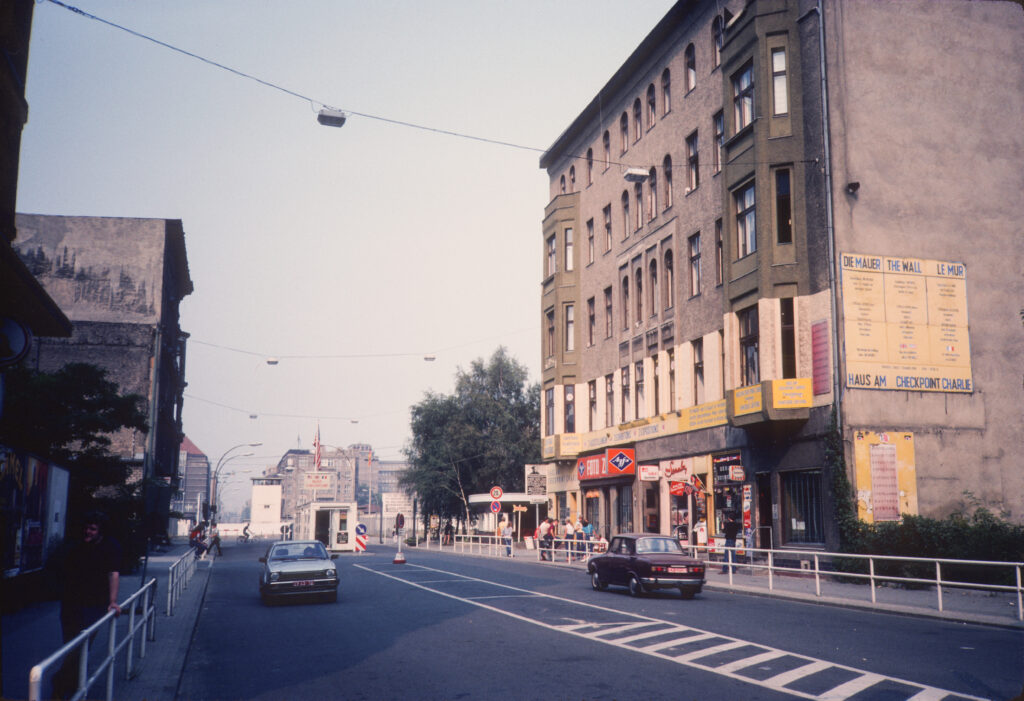
Kreuzberg – Friedrichstrasse, Checkpoint Charlie, Sept 1982 Photo credit: Miles Glendinning https://doi.org/10.7488/ds/8063

3 – How do you envisage the images in the dataset being used?

As always, it’s rather difficult to predict the very varied ways in which images such as these could be used, but I imagine that they could be useful for scholarly exploitation by historians of 20th-century Germany or of its post-war built environments, or as a more popular level, by enthusiasts for ‘Cold War heritage’ or ‘Ostalgie’?

Many thanks to Miles for taking the time to respond so insightfully to the questions.

The items containing the Berlin photos can be found at the following links:

Berlin (East)

Berlin (West)

The wider collections of tower blocks in the UK and mass housing internationally can be found at:

Tower Block UK

DOCOMOMO International Mass Housing Archive

Keith Munro,
Research Data Support Assistant

Reflections on Repository Fringe 2017

The following is a guest post by Mick Eadie, Research Information Management Officer at University of Glasgow, on his impressions of Repository Fringe 2017.

Capture1From the Arts

The first day afternoon 10×10 (lightning talk) sessions had many of the presentations on Research Data topics.  We heard talks about repositories in the arts; evolving research data policy at national and pan-national level; and archival storage and integrations between research data repositories and other systems like Archivematica, EPrints and Pure.

Repositories and their use in managing research data in the arts was kicked off with Nicola Siminson from the Glasgow School of Art with her talk on What RADAR did next: developing a peer review process for research plans.  Nicola explained how EPrints has been developed to maximise the value of research data content at GSA by making it more visually appealing and better able to deal with a multitude of non-text based objects and artefacts.   She then outlined GSA’s recently developed Annual Research Planning (ARP) tool which is an EPrints add-on that allows the researcher to provide information on their current and planned research activities and potential impact.

GSA have built on this functionality to enable the peer-reviewing of ARPs, which means they can be shared and commented on by others.   This has led to significant uptake in the use of the repository by researchers as they are keen to keep their research profile up-to-date, which has in turn raised the repository profile and increased data deposits.  There are also likely to be cost-benefits to the institution by using an existing system to help to manage research information as well as outputs, as it keeps content accessible from one place and means the School doesn’t need to procure separate systems.

On Policy

We heard from Martin Donnelly from the DCC on National Open Data and Open Science Policies in Europe.  Martin talked about the work done by the DCC and SPARC Europe in assessing policies from across Europe to assess the methodologies used by countries and funders to promote the concept of Open Data across the continent.   They found some interesting variants across countries: some funder driven, others more national directives, plans and roadmaps.  It was interesting to see how a consensus was emerging around best practice and how the EU through its Horizon 2020 Open Research Data Pilot seemed to be emerging as a driver for increased take up and action.

Storage, Preservation and Integration

No research data day would be complete without discussing archival storage and preservation.  Pauline Ward from Edinburgh University gave us an update on Edinburgh DataVault: Local implementation of Jisc DataVault: the value of testing. She highlighted the initial work done at national level by Jisc and the research data Spring project, and went on to discuss the University of Edinburgh’s local version of Data Vault which integrates with their CRIS system (Pure) – allowing a once only upload of the data which links to metadata in the CRIS and creates an archival version of the data.  Pauline also hinted at future integration with DropBox which will be interesting to see develop.

Alan Morrison from the University of Strathclyde continued on the systems integration and preservation theme by giving as assessment of Data Management & Preservation using PURE and Archivematica. He gave us the background to Strathclyde’s systems and workflows between Pure and Archivematica, highlighting some interesting challenges in dealing with file-formats in the STEM subjects which are often proprietary and non-standard.

Managing data: photographs in research

In collaboration with Scholarly Communications, the Data Library participated in the workshop “Data: photographs in research” as part of a series of workshops organised by Dr Tom Allbeson and Dr Ella Chmielewska for the pilot project “Fostering Photographic Research at CHSS” supported by the College of Humanities and Social Science (CHSS) Challenge Investment Fund.

In our research support roles, Theo Andrew and I addressed issues associated with finding and using photographs from repositories, archives and collections, and the challenges of re-using photographs in research publications. Workshop attendants came from a wide range of disciplines, and were at different stages in their research careers.

First, I gave a brief intro on terminology and research data basics, and navigated through media platforms and digital repositories like Jisc Media Hub, VADS, Wellcome Trust, Europeana, Live Art Archive, Flickr Commons, Library of Congress Prints & Photographs Online Catalog (Muybridge http://hdl.loc.gov/loc.pnp/cph.3a45870) – links below.

Eadweard Muybridge. 1878. The Horse in motion. Photograph.

From the Library of Congress Prints and Photographs Online Catalog

Then, Theo presented key concepts of copyright and licensing, which opened up an extensive discussion on what things researchers have to consider when re-using photographs and what institutional support researchers expect to have. Some workshop attendees shared their experience of reusing photographs from collections and archives, and discussed the challenges they face with online publications.

The last presentation tackling the basics of managing photographic research data was not delivered due to time constraints. The presentation was for researchers who produce photographic materials, however, advice on best RDM practice is relevant to any researcher independently of whether they are producing primary data or reusing secondary data. There may be another opportunity to present the remaining slides to CHSS researchers at a future workshop.

ONLINE RESOURCES

LICENSING

Digital Scholarship Day of Ideas: Data

The theme of this year’s ‘Digital Scholarship Day of Ideas’ (14th May) focused on ‘data’ and what data is for the humanities and social sciences. This post summarises the presentation of Prof Annette Markham, the first speaker of the day. She started her presentation with an illustration of Alice in Wonderland. She then posed the question: What does data mean anyway?

Markham then explained how she had quit her job as a professor in order to enquire into the methods used in different disciplines. Since then, she has thought a lot about method and methodologies, and run many workshops on the theme of ‘data’. In her view, we need to be careful when using the term ‘data’ because although we think we are talking about the same thing we have different understandings of what the term actually means. So, we need to critically interrogate the word and reflect upon the methodologies.

Markham talked about the need to look at ‘methods’ sideways, we need to look at them from above and below. We need to collate as many insights into these methods as possible; we might then understand what ‘data’ means for different disciplines. Sometimes, methods are related to funding, which can be an issue in the current climate, because innovative data collection procedures that might not be suitable for archival aren’t that valuable to funders. The issue is that not all research can be added to digital archives. For an ethnographer, a stain of coffee in a fieldwork notebook has meaning, but this subtle meaning cannot be archived or be meaningful to others unless digitised and clearly documented.

Drawing on Gregory Bateson’s Steps to an Ecology of Mind (1972), she asked us to think about ‘frames’ and how these draw our attention to what is inside and dismiss what lays outside. If you change the frame with which you look, it changes what you see. She showed and suggested using different frames. For example there are: traditional frames, structures like the sphere, molecular structures. Different structures afford different ways of understanding, and convey themes and ideas that are embedded within them.

Empty-framesphere-296433_1280Azithromycin_3d_structure


To use another example, she used an image of McArthur’s Universal Corrective Map of the World to illustrate how our understanding of our environment changes when information is shown and structured in a different and unexpected way.

  • What happens when we change the frame?
  • How does the structure shape the information and affect the way we engage with it?

Reversed Earth map 1000x500
Satellite image of McArthur’s Austral-centric view of the world [Public domain]

1. How do we frame culture and experiences in the 21st Century? How has our concept of society changed since the internet?
Continuing the discussion on frames, she spoke about how the internet has brought on a significant frame shift. This new frame has influenced the way we interact with media and data. To illustrate this, she showed work by Sparacino, Pentland, Davenport, Hlavac and Obelnicki, who in the project the ‘City of News’ (Sparacino, 1997) addressed this frame shift caused by the internet. The MIT project (1996) presented a 3D information browsing system, where buildings were the information spaces where information would be stored and retrieved. Through this example, Markham emphasized how our interaction with information and the methods we use for looking at social culture are changing, and so are the visual-technical frames we use to enquire into the world.

2. How do we frame objects and processes of enquiry?
She argued that this framing of objects and processes hasn’t changed enough. If we were to draw a picture or map of what research is and how the data in any research project is structured, we would end up with a multi-dimensional mass of connected blobs and lines instead of with a neatly composed bi-dimensional picture frame (research looks more like a molecular structure than like a rectangular frame). However, we still associate qualitative research with traditional ethnographic methods and we see quite linear and “neat and tidy” methods as legitimate. There is a need to look at new methods of collecting and analysing research ‘data’ if we are to enquire into socio-cultural changes.

3. How do we frame what counts as proper legitimate enquiry?
In order to change the frame, we have to involve the research community. The frame shift can happen, even if slowly, when established research methods are reinvented. Markham used 1960s feminist scholars as an example, for they approached their research using a frame that was previously inconceivable. This new methodological approach was based on situated knowledge production and embodied understanding, which challenged the way in which scientific research methods had been operating (more on the subject, (Haraway 1988). But in the last decade at least we are seeing an upsurge of to scientific research methods – evidence based, problem solving approaches – dominating the funding and media understanding of research.

So, what is DATA?
‘Data’ is often an easy term to toss around, as it stands for unspecified stuff. Ultimately, ‘data’ is “a lot of highly specific but unspecified stuff”, that we use to make sense of the world around us, a phenomenon. The term ‘data’ is a arguably quite a powerfully rhetorical word in humanities and social sciences, in that it shapes what we see and what we think.

The term data comes from the Latin verb dare, to give. In light of this, ‘data’ is something that is already given in the argument – pre-analytical and pre-semantics. Facts and arguments might have theoretical underpinnings, but data is devoid of any theoretical value. Data is everywhere. Markham referring to Daniel Rosenberg‘s paper ‘Data before the fact’, pointed out that facts can be proved wrong, and then they are no longer a facts, but data is always data even when proven wrong. In the 80s, she was trained not to use the term ‘data,’ they said:

“we do not use it, we collect material, artifacts, notes, information…”

Data is conceived as something that is discrete, identifiable, disconnected. The issue, she said was that ‘data’ poorly represents a conversation (gesture and embodiment), the emergence of meaning from non verbal information, because when we extract things from their context and then use them as a stand-alone ‘data’, we loose a wealth of information.

Markham then showed two ads (Samsung Galaxy SII and Global Pulse) to illustrate her concerns about life becoming data-fied. She referenced Kate Crawford’s perspective on “big data fundamentalism”, because not all human experiences can be reduced to big data, to digital signals, to data points. We have to trouble the idea of thinking about “humans (and their data) as data”. We don’t understand data as it is happening, and “data has never been raw”. Data is always filtered, transformed. We need to use our strong and robust methods of enquery, and that these do not necessarily focus on data as the centre stage, it may be about understanding the phenomenon of what we have made,this thing called data. We have to remember that that’s possible.

Data functions very powerfully as a term, and from a methodological perspective it creates a very particular frame. It warrants careful consideration, especially in an era where the predominant framework is telling us that data is really the important part of research.

References

  • Image of Alice in Wanderland after original illustration by Danny Pig (CC BY-SA 2.0)
  • Sparacino, Flavia, A. Pentland, G. Davenport, M. Hlavac and M. Obelnicki (1997). ‘City of News’ in Proceedings of Ars Electronica Festival, Linz, Austria, 8-13 Sep.
  • Bateson, Gregory (1972). Steps to an ecology of mind: collected essays in anthropology, psychiatry, evolution, and epistemology. Aylesbury: Intertext.
  • Frame by Hubert Robert [Public domain], via Wikimedia Commons
  • Sphere by anonymous (CC 1.0) [Public Domain]
  • Image of 3D structure (CC BY-SA 3.0)
  • Map by Poulpy, from work by jimht[at]shaw[dot]ca, modified by Rodrigocd, from Image Earthmap1000x500compac.jpg, [Public domain], via Wikimedia Commons
  • Rosenberg, Daniel (2013). ‘Data before the fact’ in Lisa Gitelman (ed.) “Raw data” is an oxymoron. Cambridge, Mass.: MIT Press, pp. 15–40.

More about

Rocio von Jungenfeld
Data Library Assistant