Data Visualisation with D3 workshop

Last week I attended the 4th HSS Digital Day of Ideas 2015. Amongst networking and some interesting presentations on the use of digital technologies in humanities research (the two presentations I attended focused on analysis and visualisation of historical records), I attended the hands-on `Data Visualisation with D3′ workshop run by Uta Hinrichs, which I thoroughly enjoyed.

The workshop was a crash course to start visualising data combining d3.js and leaflet.js libraries, with HTML, SVG, and CSS. For this, we needed to have installed a text editor (e.g. Notepad++, TextWrangler) and a server environment for local development (e.g. WAMP, MAMP). With the software installed beforehand, I was ready to script as soon as I got there. We were recommended to use Chrome (or Safari), for it seems to work best for JavaScript, and the developer tools it offers are pretty good.

First, we started with the basics of how the d3.js library and other JavaScript libraries, such as jquery or leaflet, are incorporated into basic HTML pages. D3 is an open source library developed by Mike Bostocks. All the ‘visualisation magic’ happens in the browser, which takes the HTML file and processes the scripts as displayed in the console. The data used in the visualisation is pulled into the console, thus you cannot hide the data.

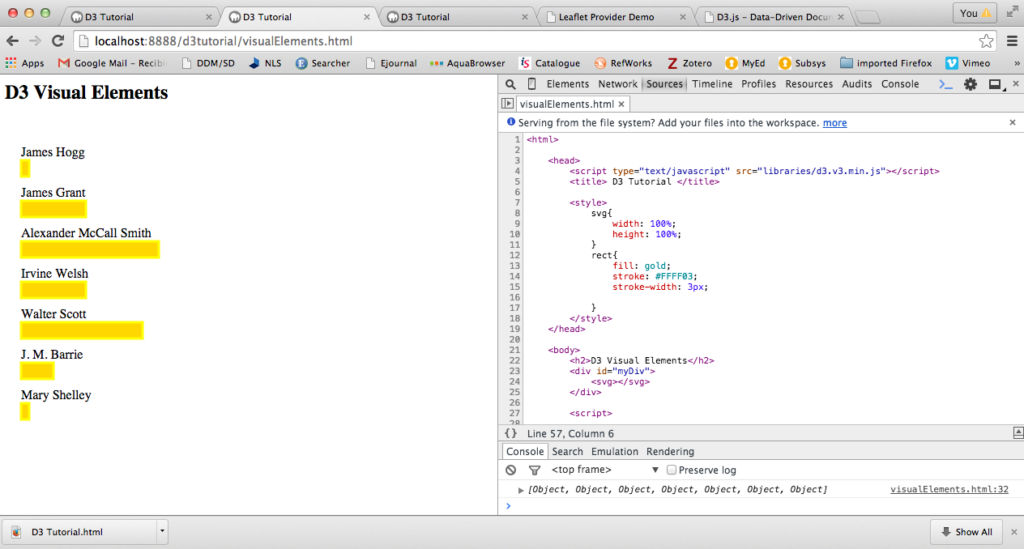
For this visualisation (D3 Visual Elements), the browser uses the content of the HTML file to call the d3.js library and the data into the console. In this example, the HTML contains a bit of CSS and SVG (Scalable Vector Graphics) element with a d3.js script which pulls data from a CSV file containing the details: author and number of books. The visualisation displays the authors’ names and bars representing the number of books each author has written. The bars change colour and display the number of books when you hover over.

Visualising CSV data with D3 JavaScript library

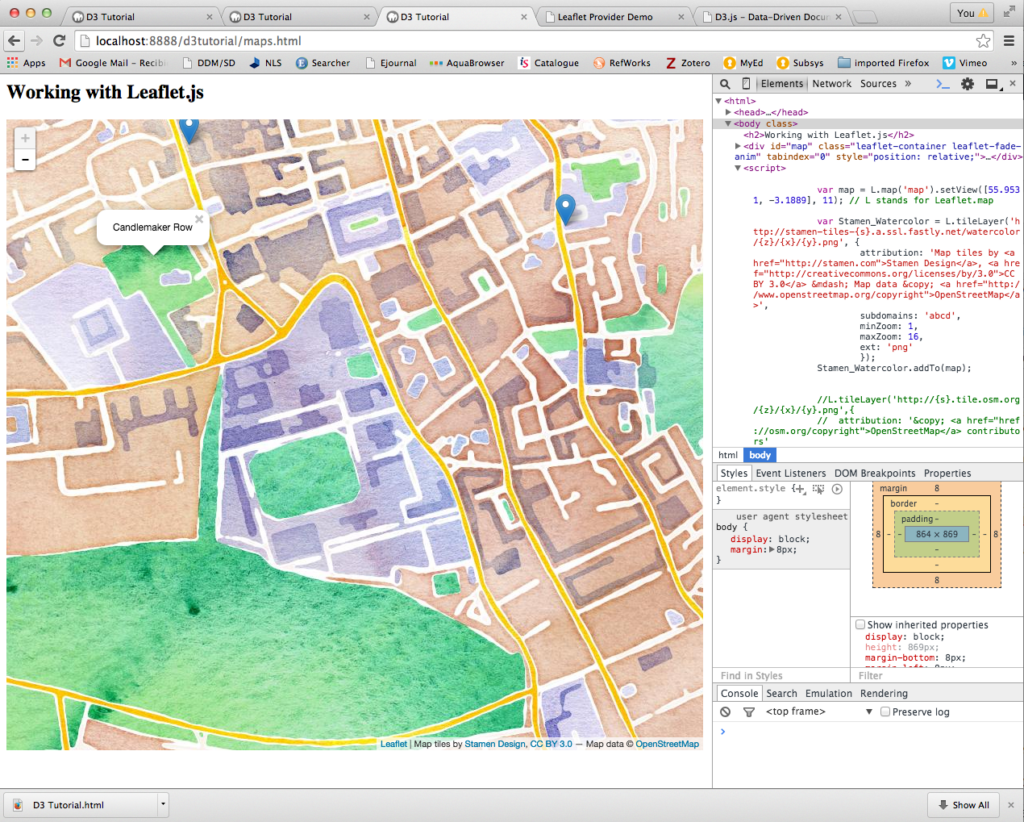
The second visualisation we worked on was the combination of geo-referenced data and leaflet.js library. Here, we combine the d3.js and leaflet.js libraries to display geographic data from a CSV file. First we ensured the OpenStreetMap loaded, then pulled the CSV data in and last customised the map using a different map tile. We also added data points to the map and pop-up tags.

Visualising CSV data using leaflet JavaScript library

In this 2-hour workshop, Uta Hinrichs managed to give a flavour of the possibilities that JavaScript libraries offer and how ‘relatively easy’ it is to visualise data online.

Workshop links:

Other links:

Rocio von Jungenfeld
EDINA and Data Library

Research Data Spring – blooming great ideas !

The University of Edinburgh have been busy putting ideas together for Jisc’s Research Data Spring project, part of the research at risk co-design challenge area, which aims to find new technical tools, software and service solutions, which will improve researchers’ workflows and the use and management of their data (see: http://researchdata.jiscinvolve.org/wp/2014/11/24/research-data-spring-let-your-ideas-bloom/).

Library and University Collections in collaboration with colleagues from the University of Manchester have submitted an idea to prototype and then develop ann open source data archive application that is technology agnostic and can sit on top of various underlying storage or archive technologies – see: http://researchatrisk.ideascale.com/a/dtd/Develop-a-DataVault/102647-31525)

EDINA & Data Library have submitted two ideas, namely:

A ‘Cloud Work Bench’ to provide researchers in the geospatial domain (GI Scientists, Geomaticians, GIS experts) with the tools, storage and data persistence they require to conduct research without the need to manage the same in a local context that can be fraught with socio-technical barriers that impede the actual research (see: http://researchatrisk.ideascale.com/a/dtd/Cloud-Work-Bench/101899-31525)

An exploration of the use of Mozilla Open Badges as certification of completion of MANTRA (Research Data Management Training), a well-regarded open educational resource (see: http://researchatrisk.ideascale.com/a/dtd/Open-Badges-for-MANTRA-resource/102084-31525)

Please register with ideascale (http://researchatrisk.ideascale.com/) and VOTE for our blooming great ideas!!

Stuart Macdonald
RDM Service Coordinator

Data journals – an open data story

Here at the Data Library we have been thinking about how we can encourage our researchers who deposit their research data in DataShare to also submit these for peer review.

Why? We hope the impact of the research can be enhanced with the recognised added-value of peer review. Regardless whether there is a full-blown article to accompany the data.

We therefore decided recently to provide our depositors with a list of websites or organisations where they could do this.

I pulled a table together, from colleagues’ suggestions, from the PREPARDE project and the latest RDM textbook. And, very much in the Open Data spirit, I then threw the question open on Twitter:

“[..]does anyone have an up-to-date list of journals providin peer review of datasets (without articles), other than PREPARDE? #opendata

…and published the draft list for others to check or make comments on. This turned out to be a good move. The response from the Research Data Management community on Twitter was very heartening, and colleagues from across the globe provided some excellent enhancements for the list.

That process has given us confidence to remove the word ‘Draft’ from the title – the list, this crowd-sourced resource, will need to be updated from time-to-time, but we are confident that we’ve achieved reasonable coverage of the things we were looking for.

Another result of this search was the realisation that what we had gathered was in fact quite clearly a list of Data Journals. My colleague Robin Rice has now added a definition of that term to the list, and we will be providing all our depositors with a link to it:

https://www.wiki.ed.ac.uk/display/datashare/Sources+of+dataset+peer+review

SCAPE workshop (notes, part 1)

The aim of the SCAPE workshop was to show participants how to cope with large data volumes by using automation and preservation tools developed and combined as part of the SCAPE project. During the workshop, we were introduced to Taverna workbench, a workflow engine we we installed with a virtual machine (Linux) in our laptops.

It has taken me a while to sort out my notes from the workshop, facilitated by Rainer Schmidt (Austrian Institute of Technology, AIT), Dave Tarrant (Open Planets Foundation, OPF), Roman Graf (AIT), Matthias Rella (AIT), Sven Schlarb (Austrian National Library, ONB), Carl Wilson (OPF), Peter May (British Library, BL), and Donal Fellows (University of Manchester, UNIMAN), but here it is. The workshop (September 2013) started with a demonstration of scalable data migration processes, for which they used a number of Raspberry Pis as a computer cluster (only as proof of concept).

Rainer Schimdt (AIT)

Here is a summary of the presentation delivered by Rainer Schmidt (AIT) who explained the SCAPE project framework (FP7 16 organizations from 8 countries). The SCAPE project focuses on planning, managing and preserving digital resources using the concept of scalability. Computer clusters can manage data loads and distribute preservation tasks that cannot be managed in desktop environments. Some automated distributed tasks they have been investigating are extraction of metadata, file format migration, bit checking, quality assurance, etc.

During the workshop, facilitators showed scenarios created and developed as part of the SCAPE project, which had served as test bed to identify best use of different technologies in the preservation workflow. The hands-on activities started with a quick demonstration of the SCAPE preservation platform and how to execute a SCAPE workflow when running it in the virtual machine.

SCAPE uses clusters of commodity hardware to generate bigger environments to make preservation tasks scalable, to distribute the power required for computing efficiently, and to minimise errors. The systems’ architecture is based on partitions. If failure occurs, it only affects one machine and the tasks that it performs, instead of affecting a bigger group of tasks. The cluster can also be used by a number of people, so only a specific part of the cluster gets affected by the error and thereby only one user.

A disadvantage of distributing tasks in a cluster is that you have to manage the load balancing. If you put loads of data into the system, the system distributes the data among the nodes. Once the the distributed data sets have been processed, the results are sent to nodes where the results are aggregated. You have to use a special framework to deal with the distribution environment. SCAPE uses algorithms to find and query the data. The performance of a single CPU is far too small, so they use parallel computing to bring all the data back together.

The Hadoop framework (open source Apache) allows them to deal with the details of scalable preservation environments. Hadoop is a a distributed file system and execution platform that allows them to map, reduce and distribute data and applications. The biggest advantage of Hadoop is that you can build applications on top, so it is easier to build a robust application (the computation doesn’t break because a node goes down or fails). Hadoop relies on the MapReduce programming model which is widely used for data-intensive computations. Google hosts MapReduce clusters with thousands of nodes used for indexing, ranking, mining web content, and statistical analysis, Java APIs and scripts.

The SCAPE platform brings the open source technologies Hadoop, Taverna and Fedora together. SCAPE is currently using Hadoop version 1.2.0. Taverna which allows you to visualise and and model tasks, make them repeatable, and use repository technology such as Fedora (http://www.fedora-commons.org/). The SCAPE platform incorporates the Taverna workflow management system as a workbench (http://www.taverna.org.uk) and Fedora technology as the core repository environment.

You can write your own applications, but a cost-effective solution is to incorporate preservation tools such as Jhove or METS into the Taverna workflow. Taverna allows you to integrate these tools in the workflow, and supports repository integration (read from and distribute data back into preservation environments such as Fedora). The Taverna workflow (sandpit environment) can be run on the desktop, however for running long workflows you might want to run Taverna on the internet. More information about the SCAPE platform and how Hadoop, Taverna and Fedora are integrated is available at http://www.scape-project.eu/publication/1334/.

Setting up a preservation platform like this also entails a series of challenges. Some of the obstacles you might encounter are mismatches in the parallelisation (difference between desktop and cluster environment). Workflows that work for repositories might not work for web archiving, because they use different distributed environments. To avoid mismatches use a cluster that is centred on specific workflow needs. Keeping the cluster in-house is something of which institutions are wary, while on the other hand they may be reluctant about transferring big datasets over the internet.

Related links:

http://openplanetsfoundation.org/
http://wiki.opf-labs.org/display/SP/Home
http://www.myExperiment.org/